
-5.png)
Quarter In Review
Markets were off to one of the best start in decades during the first half of 2023—then came the third quarter.
The strong performance of markets over the first half of the year continued through July, as economic data strengthened market participants’ view that a “soft landing” was in sight, which could prompt the Fed to cease and perhaps even ease monetary tightening.
However, the Federal Reserve resumed increasing rates, bringing them to a 22-year high at the Federal Open Market Committee (FOMC) meeting at the end of July. This led to ongoing elevated interest rates through August, pushing bond yields higher and challenging lofty equity valuations.
By September, the benchmark 10-year U.S. Treasury yield hit levels unseen since 2007. Risk assets suffered from the relentless rise in interest rates joined by headwinds from an auto strike, the specter of a looming government shutdown, rising oil prices, lackluster growth overseas (particularly China), and the restart of student loan payments.1
While returns from equities are still positive for the year, they finished the quarter down across the board. In the United States, the NASDAQ finished the quarter down -3.94%, the S&P 500 was down -3.27%, while the Dow finished down -2.10%. International Developed and Emerging Markets also finished the quarter down, with the MSCI World ex USA index down -4.10% and the MSCI EM index down -2.93%.2
Bond markets continued their struggles in the face of surging yields as financial markets price in a lower chance of recession, leading to central banks keeping rates higher for longer. Ten-year government yields hit new year-to-date highs in the U.S. and Eurozone.
Yield curves also remained inverted across one of the largest developed markets but flattened over the quarter as yields rose more at the long end than at the short end. The Bloomberg U.S. Aggregate Bond Index, or the “Agg,” finished down -3.23% for the quarter. At the same time, the Bloomberg Global Aggregate Index, representing bonds from developed and emerging markets, ended down -3.59% for the quarter.3
What’s Been Driving Markets
The Economy, Inflation & the Fed
The economy keeps powering ahead. There have been some signs of cooling—the pace of job creation has slowed, Quits and Job Openings are down, wage growth has slowed, and many broad inflation measures are lower than they were at the beginning of the year. However, consumption remains strong, and the labor market remains relatively tight.
Amid this backdrop, the Federal Reserve lifted rates at its July meeting to 5.25% to 5.5%, a 22-year high, though it opted to keep interest rates steady at the conclusion of its September meeting. However, the policy-setting committee still lifted its median rate outlook for 2024 and 2025, indicating that it expects to keep rates higher for longer than anticipated.4
Market participants, most of whom had anticipated a cessation and potential reversal of rates, reacted negatively to the news. After the Fed’s post-September meeting announcement, 2-year, 5-year, and 10-year Treasury yields hit one of their highest levels in over a decade.
Oil
Rising oil prices have animated market participants’ fears of reinvigorated inflation pressures, increasing the chances that the Federal Reserve may impose more interest rate hikes.
Several factors have driven the rise in prices. The U.S. economy has been stronger than expected, consuming more oil than forecast over the past year. Also, Saudi Arabia and OPEC+ (which includes Russia) announced they would restrict supplies until the end of the year (and perhaps beyond), causing global supply to tighten and push prices further up.
Since the end of June, West Texas Intermediate crude oil prices have climbed toward $100/barrel in trading, the highest in 10 months for the U.S. benchmark. Meanwhile, gasoline prices have jumped 11% from July to August, driving more than half of overall monthly inflation. Those trends continued into September.5
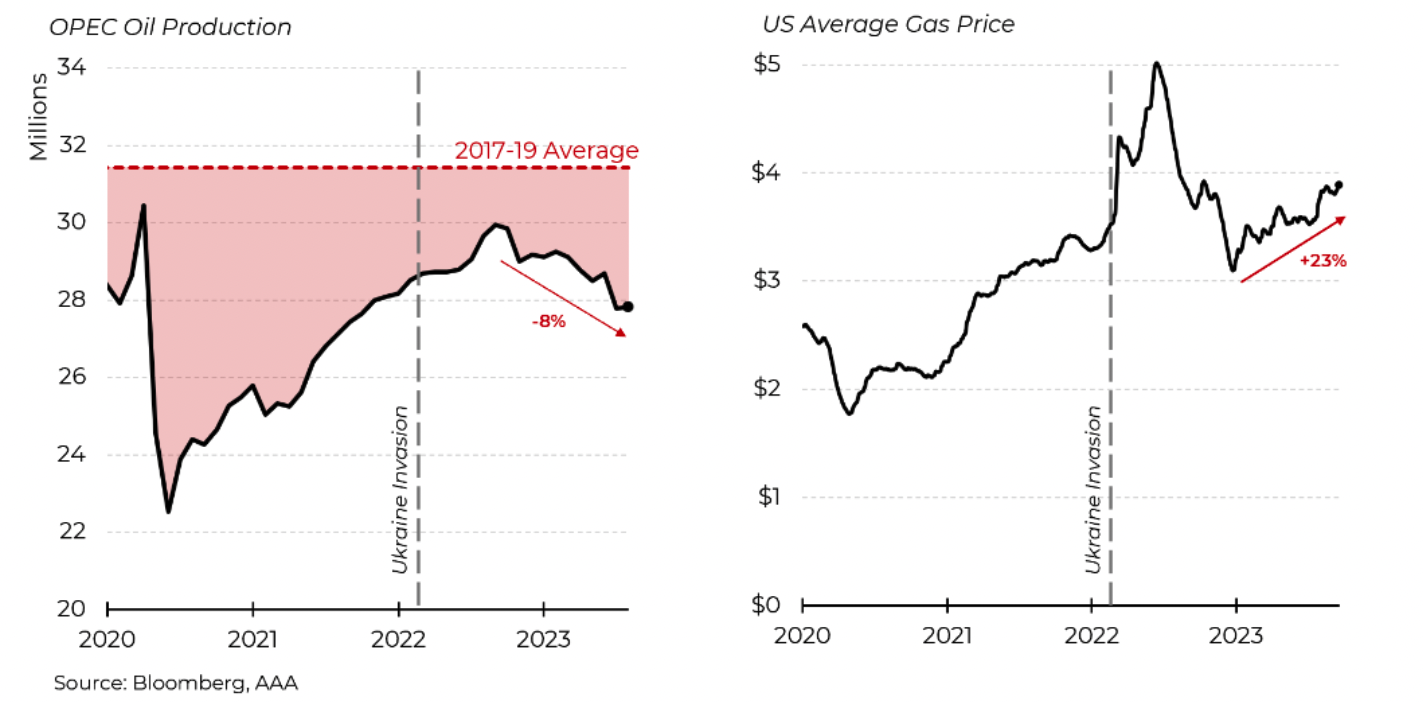
Source: Bloomberg, as of September 30, 2023
Final Thoughts
Maintaining a disciplined long-term focus when it comes to investing can be incredibly hard. Why?
Ignoring large amounts of potential information is difficult, as we feel the need to respond constantly when things change—and things are continually changing.
This causes anxiety, and our evolutionary instincts lead us to prioritize immediate relief of anxiety.
However, research has shown that we are poor at evaluating the value of long-term rewards and tend to focus too heavily on short-term payoffs. Therefore, our decisions often reflect our current emotional state and are rarely made with long-term outcomes in mind.
Short-term returns may evoke excitement or disappointment, but they have a limited impact on long-term results.
If we take a look at the experience of a hypothetical “patient and disciplined long-term investor” by using rolling 30-year returns on the S&P 500 since 1950 (the blue line on the chart below) and compare that to the short-term ups and downs of the S&P 500 each year for the last 30 years (the orange bars), we can gain valuable insights.
When the “wall of worry” looms, stay disciplined. The long-term rewards of investing await on the other side. As always, we will continue to support you for the long haul.
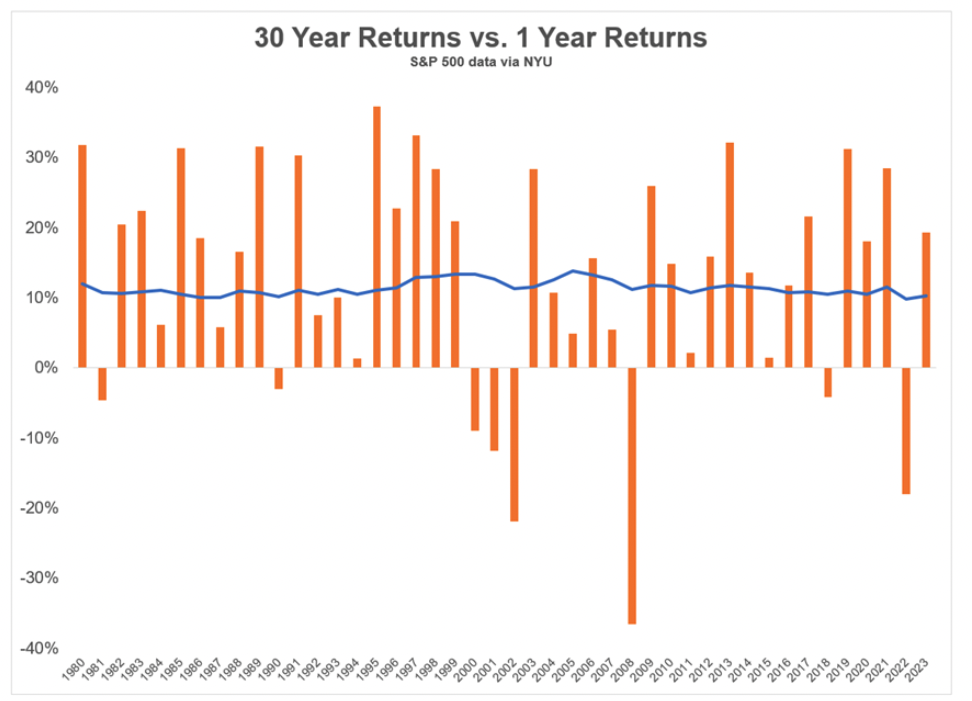
Source: A Wealth of Common Sense (https://awealthofcommonsense.com/2023/07/one-year-returns-dont-matter/), data as of July 30, 2023
1. Morningstar Direct, as of September 30, 2023
2. Ibid
3. Ibid
4. Marte, J. (September 20, 2023). Fed signals Interest rates will Stay Higher-for-Longer with hikes almost done. Bloomberg.com. https://www.bloomberg.com/news/articles/2023-09-20/fed-signals-higher-for-longer-rates-with-hikes-almost-finished
5. Where our oil comes from - U.S. Energy Information Administration (EIA). (n.d.). https://www.eia.gov/energyexplained/oil-and-petroleum-products/where-our-oil-comes-from.php
Symmetry Partners, LLC, is an investment advisory firm registered with the Securities and Exchange Commission (SEC).
The firm only transacts business in states where it is properly registered, or excluded or exempt from registration requirements. Registration with the SEC or any state securities authority does not imply a certain level of skill or training. Different types of investments involve varying degrees of risk, and there can be no assurance that the future performance of any specific investment, investment strategy, product or any non- investment related content made reference to directly or indirectly in this commentary will be profitable, equal any corresponding indicated historical performance level(s), be suitable for your portfolio or individual situation, or prove successful. Due to various factors, including changing market conditions and/or applicable laws, the content may not be reflective of current opinions or positions. Please note the material is provided for educational and background use only. Moreover, you should not assume that any discussion or information contained in this material serves as the receipt of, or as a substitute for, personalized investment advice. Diversification seeks to improve performance by spreading your investment dollars into various asset classes to add balance to your portfolio. Using this methodology, however, does not guarantee a profit or protection from loss in a declining market. Past performance does not guarantee future results.
Index Disclosure and Definitions All indexes have certain limitations. Investors cannot invest directly in an index. Indexes have no fees. Historical performance results for investment indexes generally do not reflect the deduction of transaction and/or custodial charges or the deduction of an investment management fee, the incurrence of which would have the effect of decreasing historical performance. Actual performance for client accounts may differ materially from the index portfolios.
S&P 500 Index represents the 500 leading U.S. companies, approximately 80% of the total U.S. market capitalization. Dow Jones Industrial Average (DJIA) Is a price-weighted average of 30 significant stocks traded on the New York Stock Exchange (NYSE) and the NASDAQ. The Nasdaq Composite Index (NASDAQ) measures all Nasdaq domestic and international based common type stocks listed on The Nasdaq Stock Market, and includes over 2,500 companies. MSCI World Ex USA GR USD Index captures large and mid cap representation across 22 of 23 developed markets countries, excluding the U.S. The index covers approximately 85% of the free float-adjusted market capitalization in each country. MSCI Emerging Markets Index is a free float-adjusted market capitalization index that is designed to measure equity market performance in the global emerging markets (as defined by MSCI). The index consists of the 25 emerging market country indexes. Bloomberg Barclays U.S. Aggregate Bond Index measures the performance of the U.S. investment grade bond market. The index invests in a wide spectrum of public, investment-grade, taxable, fixed income securities in the United States – including government, corporate, and international dollar-denominated bonds, as well as mortgage-backed and asset-backed securities, all with maturities of more than 1 year. Bloomberg Barclays Global Aggregate (USD Hedged) Index is a flagship measure of global investment grade debt from twenty-four local currency markets. This multi-currency benchmark includes treasury, government-related, corporate and securitized fixed-rate bonds from both developed and emerging market issuers. Index is USD hedged.
© Morningstar 2023. All rights reserved. The information contained herein: (1) is proprietary to Morningstar and/or its content providers; (2) may not be copied, adapted or distributed; and (3) is not warranted to be accurate, complete or timely. Neither Morningstar nor its content providers are responsible for any damages or losses arising from any use of this information, except where such damages or losses cannot be limited or excluded by law in your jurisdiction. Past financial performance is no guarantee of future results.