

It has been a rough start to the year for the stock market. After several highly volatile trading days this week, 2022 is now officially off to the worst-ever start in the history of the S&P 500 (going back to 1929). Market participants are grappling with the end of asset purchases by the Fed, rising interest rates in the near future, and a growing geopolitical crisis along the Ukrainian border, all of which are prompting a flight to safely.
The sell-off has been even worse for the tech-heavy Nasdaq composite index, which has officially entered correction territory (down more than 10%).
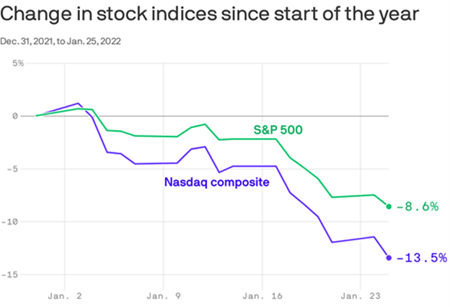
Data: FactSet
Rising rates are conventionally thought to be more of a threat to bonds, than stocks. But tech stocks tend to also be vulnerable to rising interest rates because they have higher price-to-earnings ratios with most of their peak earnings anticipated at some point in the future, when higher interest rates might reduce the value of those future cashflows, thus pushing the current price lower.
After taking the US market to a record high at the end of 2021, shares in big US tech groups have been among the hardest hit on Wall Street. Broadly speaking, the sheer weight of the tech sector within the major indices now contributing to dragging them down. Over the past few years, the spread between the cheapest and most expensive stocks (led by tech) widened to the largest gap ever recorded. This has undoubtedly reversed a bit since the end of December, but it could take some time for the more expensive growth stocks to fall back, value stocks to do better, or some combination of the two, for that relationship to settle into a more historically normal range.
While it is likely that the broader markets will continue to experience volatility as these issues play out, we do not recommend making any changes to your portfolios as a result. Corrections are a common feature of how markets work (there have been over 36 of them since 1950…roughly one every two years), and a key underpinning of a successful long-term investment strategy is that investors remain invested through market cycles to reap the benefits of higher potential returns over time.
Symmetry Partners, LLC, provides this communication on this site as a matter of general information. Information contained herein, including data or statistics quoted, are from sources believed to be reliable but cannot be guaranteed or warranted. Nothing on this site represents a recommendation of any particular security, strategy, or investment product. The opinions of the author are subject to change without notice. Due to various factors, including changing market conditions and/or applicable laws, the content may not be reflective of current opinions or positions. All content on this site is for educational purposes and should not be considered investment advice or an offer of any security for sale. Please be advised that Symmetry Partners does not provide tax or legal advice and nothing either stated or implied here on this site should be inferred as providing such advice. Symmetry Partners does not approve or endorse any third party communications on this site and will not be liable for any such posts.
Investing involves risk, including the loss of some or all of your principal. Diversification seeks to reduce volatility by spreading your investment dollars into various asset classes to add balance to your portfolio. Using this methodology, however, does not guarantee a profit or protection from loss in a declining market.
Index Disclosure and Definitions All indexes have certain limitations. Investors cannot invest directly in an index. Indexes have no fees. Historical performance results for investment indexes generally do not reflect the deduction of transaction and/or custodial charges or the deduction of an investment management fee, the incurrence of which would have the effect of decreasing historical performance. Actual performance for client accounts may differ materially from the index portfolios. All data is from sources believed to be reliable but cannot be guaranteed or warranted.
S&P 500 Index represents the 500 leading U.S. companies, approximately 80% of the total U.S. market capitalization.
The Nasdaq Composite Index (NASDAQ) measures all Nasdaq domestic and international based common type stocks listed on The Nasdaq Stock Market, and includes over 2,500 companies.