

“In this world, nothing is certain except death and taxes.”
Ben Franklin
When it comes to investing (as with so many other things), taxes may be inevitable, but with the right planning and portfolio, they can be minimized.
Not only can this save you money, it can have a significant impact on long-term investment returns.
That’s why finding the right solutions is so important for investors who want to minimize the impact of taxes—without compromising investment returns.
At Symmetry Partners, we offer two investment options that may help investors keep more of their money after taxes. Our PrecisionCore Tax-Managed ETF Models are built using a best-of-breed selection of noted money managers, including; Vanguard®, iShares® by BlackRock®, and State Street Global Advisors SPDR®. Each portfolio is designed to:
- Leverage the 8 factors of return identified by academic science as helping to decrease risk and/or increase potential returns*
- Provide tax-efficient strategies that may significantly reduce your tax burden each year
Tax drag—or an investment’s pre-tax return minus its after-tax return—is a common way to measure the negative impact of taxes on your portfolio. The lower the tax drag, the less you’re paying to the IRS. Symmetry’s PrecisionCore Tax-Managed models have a strong, long-term record of minimizing tax-drag, without compromising performance.
Let’s look at two PrecisionCore Models specifically--one that is 40% Stocks/60% Bonds (40/60), the other 60% Stocks/40% Bonds (60/40) vs. the universe of similar tax-managed models.
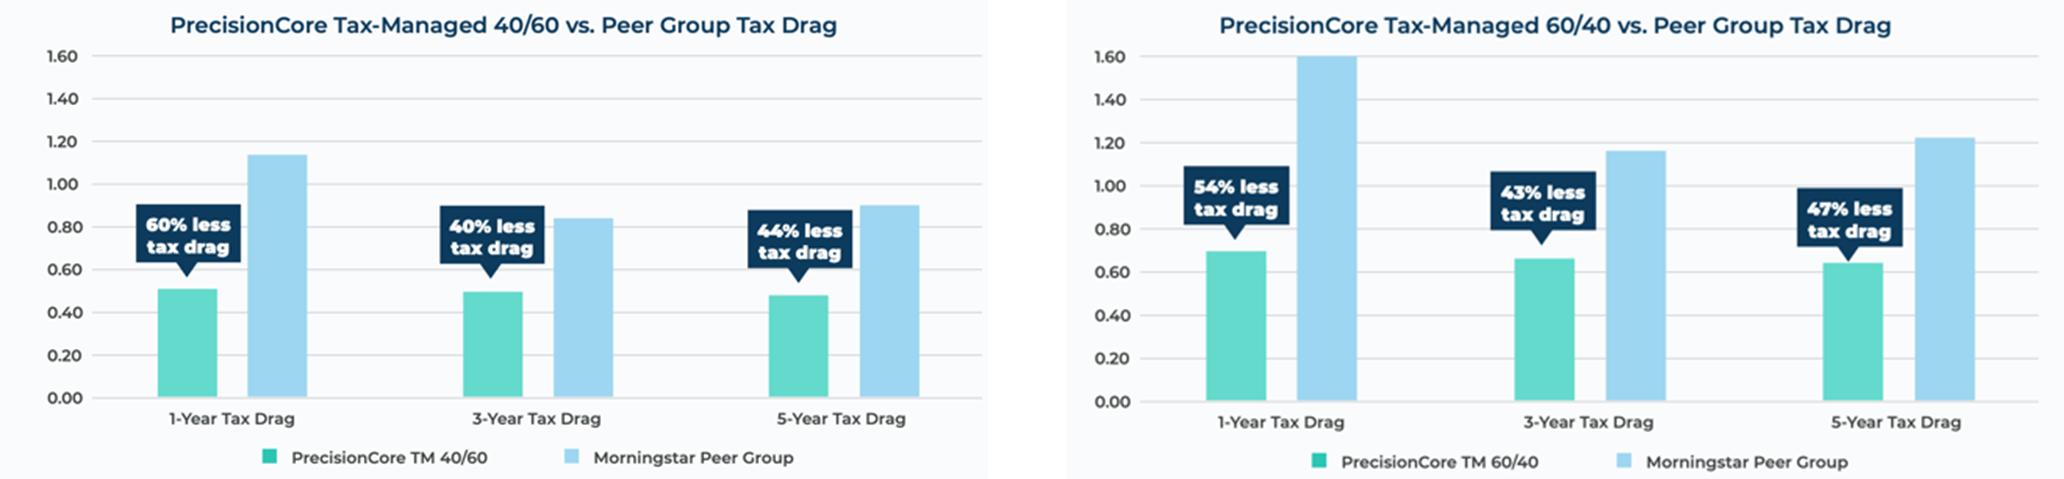
Tax Cost Ratio refers to the amount that a fund’s annualized return is reduced by taxes that investors pay on distributions (including stock dividends and bond coupon payments). Please see disclosure at end for peer group description.
As you can see above, both PrecisionCore Models are 40% - 60% more tax efficient vs. their peers over these time periods.
The Panoramic Tax-Managed Difference
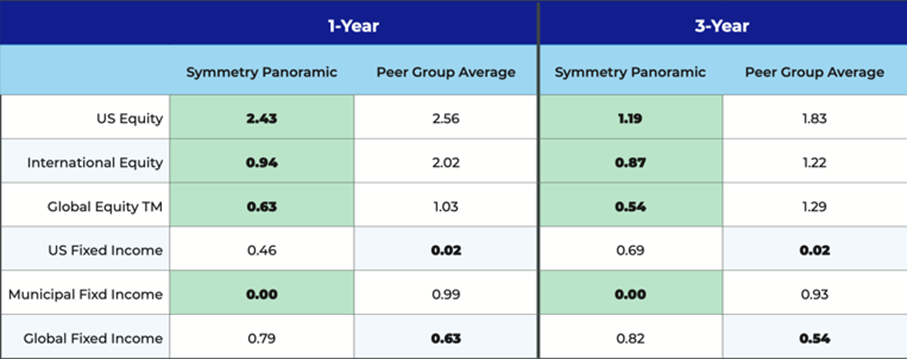
Symmetry’s Tax-Managed Symmetry Panoramic Funds and Models are similarly focused on minimizing taxes but not performance. These Funds and Models are also built using a best-of-breed selection of noted money managers including; Dimensional, AQR, Vanguard®, iShares® by BlackRock®, and Avantis Investors® In 2021, 4 out of six mutual funds in Symmetry’s tax-managed Models had significantly lower tax drag than their peers over both the 1-year and 3-year period.
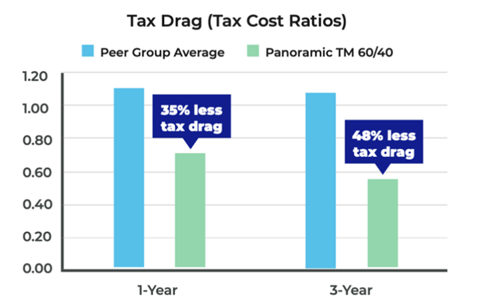
This advantage of tax-management becomes even more apparent when we look at tax-drag at the portfolio level.
TAX DRAG (TAX COST RATIOS)
Tax Cost Ratio refers to the amount that a fund’s annualized return is reduced by taxes that investors pay on distributions (including stock and bond dividends and capital gain distributions). 1 and 3-year tax drag based on longest available time-period in funds. Please see disclosure at end for peer group description.
In 2021, Panoramic’s Tax-Managed 60% Equity/40% Bonds model offered a substantially lower tax cost ratio of .72 vs 1.10 for the peer group —it was 35% more tax efficient.
The 3-year number is even better: .56 for Panoramic vs. 1.08 for the peer group-- this model was 48% more tax efficient than its peers.
Tax Cost Ratio refers to the amount that a fund’s annualized return is reduced by taxes that investors pay on distributions (including stock and bond dividends and capital gain distributions). 1 and 3-year tax drag based on longest available time-period in funds. Please see disclosure at end for peer group description.
Symmetry’s Tax-Managed Portfolio Models bring together extensive research, decades of academic insights, noted money managers, and key factors of return…all focused on helping maximize after-tax returns, and deliver a better, less taxing, investment experience.
For more details on Symmetry’s approach to tax management, watch the video below. Please be sure to like and subscribe. As always, we remain invested in your goals.
Symmetry Partners, LLC, provides this communication on this site as a matter of general information. Information contained herein, including data or statistics quoted, are from sources believed to be reliable but cannot be guaranteed or warranted. Due to various factors, including changing market conditions and/or applicable laws, the content may not be reflective of current opinions or positions. All content on this site is for educational purposes and should not be considered investment advice, recommendation or offer of any security for sale. Symmetry Partners does not approve or endorse any third party communications on this site and will not be liable for any such posts.
Investing involves risk, including the loss of some or all of your principal. Diversification seeks to reduce volatility by spreading your investment dollars into various asset classes to add balance to your portfolio. Using this methodology, however, does not guarantee a profit or protection from loss in a declining market.
Symmetry Partners, LLC is an investment advisory firm registered with the Securities and Exchange Commission. The firm only transacts business in states where it is properly registered, or exempted or excluded from registration requirements. Past performance does not guarantee future results. As with any investment strategy, there is the possibility of profitability as well as loss. Please note that (i) any discussion of U.S. tax matters contained in this material cannot be used by you for the purpose of avoiding tax penalties. (ii) this material was provided to support the promotion or marketing of the matters addressed herein; and (iii) you should seek advice based on your particular circumstances from an independent tax advisor. Neither. Symmetry nor its affiliates provide tax advice and nothing either stated or implied here should be inferred as providing such advice. Any chart that is presented in this brochure is for informational purposes only and should not be considered an all-inclusive formula for security selection.
Symmetry Partners, LLC is not affiliated with Vanguard, SPDRs, or iShares by Blackrock.
Diversification seeks to reduce volatility by spreading your investment dollars into various asset classes to add balance to your portfolio. Using this methodology, however, does not guarantee a profit or protection from loss in a declining market.
*Symmetry Partners’ investment approach seeks enhanced returns by overweighting assets that exhibit characteristics that tend to be in accordance with one or more “factors” identified in academic research as historically associated with higher returns. Please be advised that adding these factors may not ensure increased return over a market-weighted investment and may lead to underperformance relative to the benchmark over the investor’s time horizon. The factors Symmetry seeks to capture may change over time at its discretion. Currently, the major equity factors used by Symmetry and some associated research are: the market risk premium (“Capital Asset Prices: A Theory of Market Equilibrium under Conditions of Risk,” 1964), value (“Common risk factors in the returns on stocks and bonds,” 1993, small “The Relationship Between Return and Market Value of Common Stocks,” 1981), profitability (“The Other Side of Value: The Gross Profitability Premium,” 2013, quality (“Quality Minus Junk,” 2013), momentum (“Returns to Buying Winners and Selling Losers: Implications for Stock Market Efficiency,” 1993, and minimum volatility (“The Cross-Section of Volatility and Expected Returns,” 2006. On the bond side, Symmetry primarily seeks to capture maturity and credit risk premiums (“Expected Returns: An Investor’s Guide to Harvesting Market Rewards,” 2011). All data is from sources believed to be reliable but cannot be guaranteed or warranted.
Risk Disclosure Higher potential return generally involves greater risk, short- term volatility is not uncommon when investing in various types of funds including but not limited to: sector, emerging markets, small and mid-cap funds. International investing involves special risks such as currency fluctuation, lower liquidity, political and economic uncertainties, and differences in accounting standards, which risks are generally intensified for investments in emerging markets due to the relatively smaller size and lesser liquidity of these markets, high inflation rates and adverse political developments. Risks for investing in international equity include foreign currency risk, as well as, fluctuation due to economic or political actions of foreign governments and/or less regulated or liquid markets. Risks for smaller companies include business risks, significant stock price fluctuation and illiquidity. Investing in real estate entails certain risks, including changes in: the economy, supply and demand, laws, tenant turnover, interest rates (including periods of high interest rates), availability of mortgage funds, operation expenses and cost of insurance.
Investment Companies and Exchange-Traded Funds Risk. When the Fund invests in other investment companies, including ETFs, it will bear additional expenses based on its pro rata share of the other investment company’s or ETF’s operating expenses, including the management fees of the Underlying Fund in addition to those paid by the Fund. The risk of owning an Underlying Fund generally reflects the risks of owning the underlying investments the Underlying Fund holds. The Fund also will incur brokerage costs when it purchases and sells ETFs.
Exchange-traded funds tend to distribute fewer capital gains than traditional open-end mutual funds due to the in-kind redemption process, which allows the ETF to swap out low cost-basis securities. Be advised that this process defers taxes, but does not eliminate them. Investors will owe capital gains taxes on gains made in their own ETF shares. ETFs do not sell individual shares directly to investors and only issue their shares in large blocks. Exchange traded funds are subject to risks similar to those of stocks. Investment returns will fluctuate and are subject to market volatility, so that an investor’s shares, when redeemed or sold, may be worth more or less than their original cost. ETF shares are bought and sold at market price (not NAV) and are not individually redeemed from the fund.
© Morningstar 2021. All rights reserved. The information contained herein: (1) is proprietary to Morningstar and/or its content providers; (2) may not be copied, adapted or distributed; and (3) is not warranted to be accurate, complete or timely. Neither Morningstar nor its content providers are responsible for any damages or losses arising from any use of this information, except where such damages or losses cannot be limited or excluded by law in your jurisdiction. Past financial performance is no guarantee of future results.
INVESTORS SHOULD CONSIDER THE INVESTMENT OBJECTIVES, RISKS, AND CHARGES AND EXPENSES OF THE INVESTMENT COMPANY CAREFULLY BEFORE INVESTING. TO OBTAIN A PROSPECTUS, WHICH CONTAINS THIS AND OTHER INFORMATION, PLEASE CONTACT YOUR FINANCIAL ADVISOR OR VISIT THE FOLLOWING WEBSITES: WWW.VANGUARD.COM, WWW.SPDRS. COM, AND WWW.ISHARES.COM. PLEASE READ THE PROSPECTUS CAREFULLY BEFORE INVESTING.
Peer Group of each model is an allocation weighted average of the TCR of the peer group for each individual ETF included in PrecisionCore.
PrecisionCore Disclosures
Peer Group: Morningstar Category = US ETF Large Growth Large-growth portfolios invest primarily in big U.S. companies that are projected to grow faster than other large-cap stocks. Stocks in the top 70% of the capitalization of the U.S. equity market are defined as large cap. Growth is defined based on fast growth (high growth rates for earnings, sales, book value, and cash flow) and high valuations (high price ratios and low dividend yields). Most of these portfolios focus on companies in rapidly expanding industries.
Peer Group: Morningstar Category = US ETF Large Blend Large-blend portfolios are fairly representative of the overall US stock market in size, growth rates and price. Stocks in the top 70% of the capitalization of the US equity market are defined as large cap. The blend style is assigned to portfolios where neither growth nor value characteristics predominate. These portfolios tend to invest across the spectrum of US industries, and owing to their broad exposure, the portfolios’ returns are often similar to those of the S&P 500 Index
Peer Group: Morningstar Category = US ETF Large Value Large-value portfolios invest primarily in big U.S. companies that are less expensive or growing more slowly than other large-cap stocks. Stocks in the top 70% of the capitalization of the U.S. equity market are defined as large cap. Value is defined based on low valuations (low price ratios and high dividend yields) and slow growth (low growth rates for earnings, sales, book value, and cash flow).
Peer Group: Morningstar Category = US ETF Small Value Small-value portfolios invest in small U.S. companies with valuations and growth rates below other small-cap peers. Stocks in the bottom 10% of the capitalization of the U.S. equity market are defined as small cap. Value is defined based on low valuations (low price ratios and high dividend yields) and slow growth (low growth rates for earnings, sales, book value, and cash flow).
Peer Group: Morningstar Category = US ETF Foreign Large Blend Foreign large-blend portfolios invest in a variety of big international stocks. Most of these portfolios divide their assets among a dozen or more developed markets, including Japan, Britain, France, and Germany. These portfolios primarily invest in stocks that have market caps in the top 70% of each economically integrated market (such as Europe or Asia ex-Japan). The blend style is assigned to portfolios where neither growth nor value characteristics predominate. These portfolios typically will have less than 20% of assets invested in U.S. stocks.
Peer Group: Morningstar Category = US ETF Foreign Large Value Foreign large- value portfolios invest mainly in big international stocks that are less expensive or growing more slowly than other large-cap stocks. Most of these portfolios divide their assets among a dozen or more developed markets, including Japan, Britain, France, and Germany. These portfolios primarily invest in stocks that have market caps in the top 70% of each economically integrated market (such as Europe or Asia ex-Japan). Value is defined based on low valuations (low price ratios and high dividend yields) and slow growth (low growth rates for earnings, sales, book value, and cash flow). These portfolios typically will have less than 20% of assets invested in U.S. stocks.
Peer Group: Morningstar Category = US ETF Foreign Small/Mid Blend Foreign small/mid-blend portfolios invest in a variety of international stocks that are smaller. These portfolios primarily invest in stocks that fall in the bottom 30% of each economically integrated market (such as Europe or Asia ex-Japan). The blend style is assigned to portfolios where neither growth nor value characteristics predominate. These portfolios typically will have less than 20% of assets invested in U.S. stocks
Peer Group: Morningstar Category = US ETF Diversified Emerging Mkts Diversified emerging-markets portfolios tend to divide their assets among 20 or more nations, although they tend to focus on the emerging markets of Asia and Latin America rather than on those of the Middle East, Africa, or Europe. These portfolios invest predominantly in emerging market equities, but some funds also invest in both equities and fixed income investments from emerging markets.
Peer Group: Morningstar Category = US ETF Short Government Short- government portfolios have at least 90% of their bond holdings in bonds backed by the U.S. government or by government-linked agencies. This backing minimizes the credit risk of these portfolios, as the U.S. government is unlikely to default on its debt. These portfolios have durations typically between 1.0 and 3.5 years, so they have relatively less sensitivity to interest rates and, thus, low risk potential. Morningstar calculates monthly breakpoints using the effective duration of the Morningstar Core Bond Index in determining duration assignment. Short is defined as 25% to 75% of the three-year average effective duration of the MCBI.
Peer Group: Morningstar Category = US ETF Short-Term Bond Short-term bond portfolios invest primarily in corporate and other investment-grade U.S. fixed income issues and typically have durations of 1.0 to 3.5 years. These portfolios are attractive to fairly conservative investors, because they are less sensitive to interest rates than portfolios with longer durations. Morningstar calculates monthly breakpoints using the effective duration of the Morningstar Core Bond Index in determining duration assignment. Short-term is defined as 25% to 75% of the three-year average effective duration of the MCBI.
Peer Group: Morningstar Category = US ETF Intermediate Core Bond Intermediate-term core bond portfolios invest primarily in investment-grade U.S. fixed-income issues including government, corporate, and securitized debt, and hold less than 5% in below-investment-grade exposures. Their durations (a measure of interest-rate sensitivity) typically range between 75% and 125% of the three-year average of the effective duration of the Morningstar Core Bond Index.
Peer Group: Morningstar Category = US ETF Muni National Short Muni national short portfolios invest in bonds issued by state and local governments to fund public projects. The income from these bonds is generally free from federal taxes and/or from state taxes in the issuing state. To lower risk, some of these portfolios spread their assets across many states and sectors. Other portfolios buy bonds from only one state in order to get the state-tax benefit. These portfolios have durations of less than 4.5 years (or, if duration is unavailable, average maturities of less than five years).
Peer Group: Morningstar Category = US ETF Muni National Interm Muni national intermediate portfolios invest in bonds issued by various state and local governments to fund public projects. The income from these bonds is generally free from federal taxes. To lower risk, these portfolios spread their assets across many states and sectors. These portfolios have durations of 4.5 to 7.0 years (or, if duration is unavailable, average maturities of five to 12 years).
Peer Group: Morningstar Category = US ETF High Yield Bond High-yield bond portfolios concentrate on lower-quality bonds, which are riskier than those of higher-quality companies. These portfolios generally offer higher yields than other types of portfolios, but they are also more vulnerable to economic and credit risk. These portfolios primarily invest in U.S. high-income debt securities where at least 65% or more of bond assets are not rated or are rated by a major agency such as Standard & Poor’s or Moody’s at the level of BB (considered speculative for taxable bonds) and below.
Peer Group: Morningstar Category = US ETF World Bond-USD Hedged World- bond portfolios invest 40% or more of their assets in foreign bonds. Some world- bond portfolios follow a conservative approach, favoring high-quality bonds from developed markets. Others are more adventurous and own some lower- quality bonds from developed or emerging markets. Some portfolios invest exclusively outside the U.S., while others regularly invest in both U.S. and non- U.S. bonds.
Symmetry PrecisionCore 40/60 Tax-Managed Portfolios The 40/60 portfolio is engineered to provide moderate exposure to the global equity market with a slightly elevated expected return due to increased factor exposure. Typical investors in this portfolio are seeking conservative growth of principal, have a minimum investment time horizon of five years and are willing to accept limited price volatility.
Symmetry PrecisionCore 60/40 Tax-Managed Portfolios The 60/40 portfolio is engineered to provide moderate exposure to the global equity market with a slightly elevated expected return due to increased factor exposure. Typical investors in this portfolio are seeking moderate growth of principal, have a minimum investment time horizon of six years and are willing to accept moderate price volatility.
Symmetry Panoramic Disclosures
Symmetry Panoramic US Equity I
Peer Group: Morningstar Category = Large Blend
Large-blend portfolios are fairly representative of the overall US stock market in size, growth rates and price. Stocks in the top 70% of the capitalization of the US equity market are defined as large cap. The blend style is assigned to portfolios where neither growth nor value characteristics predominate. These portfolios tend to invest across the spectrum of US industries, and owing to their broad exposure, the portfolios’ returns are often similar to those of the S&P 500 Index.
Symmetry Panoramic International Equity I
Peer Group: Morningstar Category = Foreign Large Blend
Foreign large-blend portfolios invest in a variety of big international stocks. Most of these portfolios divide their assets among a dozen or more developed markets, including Japan, Britain, France, and Germany. These portfolios primarily invest in stocks that have market caps in the top 70% of each economically integrated market (such as Europe or Asia ex-Japan). The blend style is assigned to portfolios where neither growth nor value characteristics predominate. These portfolios typically will have less than 20% of assets invested in U.S. stocks. Category Group.
Symmetry Panoramic Tax-Managed Global Equity I
Peer Group: Morningstar Category = World Large Stock
World large stock portfolios invest in a variety of international stocks that are larger. World-stock portfolios have few geographical limitations. It is common for these portfolios to invest the majority of their assets in developed markets, with the remainder divided among the globe’s smaller markets. These portfolios typically have 20%-60% of assets in U.S. stocks.
Symmetry Panoramic US Fixed Income I
Peer Group: Morningstar Category = Intermediate Core-Plus Bond Intermediate-term core-plus bond portfolios invest primarily in investment- grade U.S. fixed-income issues including government, corporate, and securitized debt, but generally have greater flexibility than core offerings to hold non-core sectors such as corporate high yield, bank loan, emerging- markets debt, and non-U.S. currency exposures. Their durations (a measure of interest-rate sensitivity) typically range between 75% and 125% of the three-year average of the effective duration of the Morningstar Core Bond Index.
Symmetry Panoramic Municipal Fxd Inc I
Peer Group: Morningstar Category = Muni National Short
Muni national short portfolios invest in bonds issued by state and local governments to fund public projects. The income from these bonds is generally f ree f rom federal taxes and/or f rom state taxes in the issuing state. To lower risk, some of these portfolios spread their assets across many states and sectors. Other portfolios buy bonds from only one state in order to get the state-tax benefit. These portfolios have durations of less than 4.0 years (or average maturities of less than five years).
Symmetry Panoramic Global Fixed Inc I
Peer Group: Morningstar Category = World Bond
World bond portfolios typically invest 40% or more of their assets in fixed- income instruments issued outside of the U.S. These portfolios invest primarily in investment-grade rated issues, but their strategies can vary. Some follow a conservative approach, sticking with high-quality bonds from developed markets. Others are more adventurous, owning some lower- quality bonds from developed or emerging markets. Some portfolios invest exclusively outside the U.S., while others invest in both U.S. and non-U.S. bonds. Many consistently maintain significant allocations to non-U.S. dollar currencies, while others have the flexibility to make sizeable adjustments between their U.S. dollar and non-U.S. currency exposures.
Symmetry Panoramic 60/40 Tax-Managed Portfolios
Symmetry’s Structured Panoramic Portfolios are strategically allocated, multi-factor portfolios. They are broadly diversified and maintain exposure to approximately 12,000 stocks across U.S., international, and emerging markets. The portfolios attempt to capture some of the value, small cap, profitability, minimum volatility and momentum equity factor premiums in addition to the equity market risk premium. They also overweight U.S. stocks and real estate investment trusts relative to market cap weight. The tax-managed version of the portfolio employs some funds designed to deliver the same consistent exposure to asset classes, but with special emphasis on managing after-tax returns through the use of various tax mitigation strategies, including the avoidance of short-term capital gains when possible. The fixed income allocation is comprised of domestic and global investment grade bonds and targets a lower than market duration. It seeks to capture some of the maturity and credit fixed income premiums. Approximately 50% of the fixed income allocation is invested in municipal bonds, which provide federally tax exempt income. Symmetry’s Structured Panoramic Portfolio might be the right solution for tax sensitive investors who are seeking a complete turnkey investment solution that offers international diversification but with a home country bias. The 60/40 portfolio is engineered to provide moderate exposure to the global equity market with a slightly elevated expected return due to increased factor exposure. Typical investors in this portfolio are seeking moderate growth of principal, have a minimum investment time horizon of six years and are willing to accept moderate price volatility.