
-5.png)
Big Picture
May was a turbulent month for U.S. markets. Investors grappled with persistent inflation and uncertainty surrounding the Federal Reserve's interest rate hikes. In addition, the looming May 31 House of Representatives vote on the debt ceiling deal added pressure to already burdened markets. Despite these challenges, strong earnings in specific sectors and a rally in mega-cap tech stocks helped lift equity market returns for the month.
Equities
The strength of mega-tech fueled equity markets for the month, though most stocks and sectors declined.
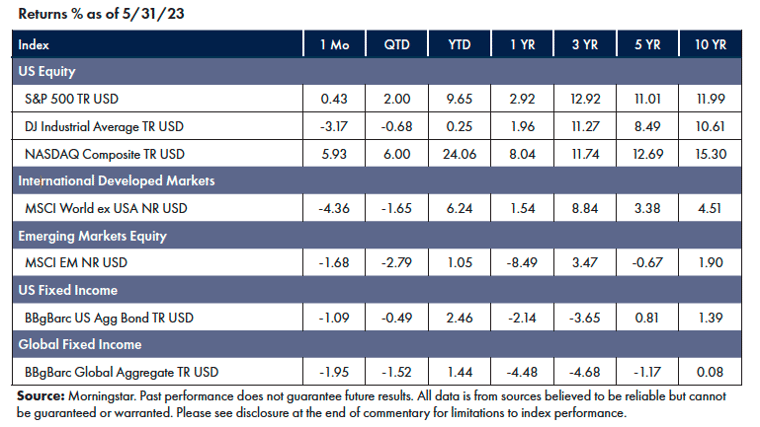
- Tech stocks powered the NASDAQ higher, lifted the S&P 500, and left the Dow struggling by comparison.
- Information Technology and Communication Services were the best-performing sectors for the month, up 9.5% and 6.2%, respectively.
- Commodities indices declined, while the VIX (measure of the stock market’s volatility expectations) was up 13.69%.[1]
Fixed Income
The debt ceiling standoff stoked bond market turbulence, which caused dramatic swings in Treasurys.
- Investors piled into ultrashort-term Treasury bills to avoid getting caught up in the debt ceiling drama, causing the spread between the one-month and three-month to hit historic levels.
- The 10/2yr U.S. yield curve remained deeply inverted.[2]
Factors
Risk factors continue to be a mixed bag. Quality has significantly outperformed market beta in the U.S. and International Developed markets. In Emerging Markets, small caps have outperformed.[3]
NEWS Impacting Markets
The Fed
Investors have continued to try and predict the Fed’s next move regarding rates. Futures markets at one point rose as high as a 70% chance of a June rate increase, only to come cascading back down after several Federal Reserve officials signaled they are increasingly likely to hold interest rates steady at their June meeting before preparing to raise them again later this summer. That would allow more time to consider the impact of the Fed’s previous 10 consecutive rate increases since March 2022 to fight high inflation, including its May 3 increase to a range between 5% and 5.25%, a 16-year high.[4]
Tech Divergence
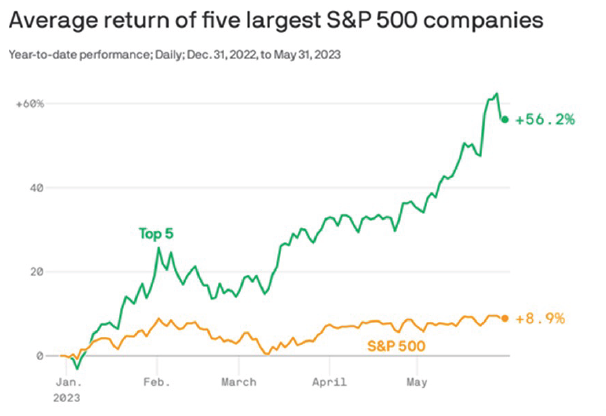
The S&P 500 is up 8.9% so far in 2023 (9.65% including dividends), but the lion’s share of that has come from the performance of a handful of companies. The top five companies, by size, are responsible for most of the stock market's 2023 gains.
If you remove Alphabet (39%), Amazon (44%), Apple (up 36% this year), Microsoft (37%), and Nvidia (which surged 159% on AI-related excitement), the overall market (including dividend payments) would be up just 1.5% this year. If you remove the next two largest tech companies—Meta (up 120% in 2023) and Tesla (66%)—the returns for the S&P 500 would be slightly negative for the year.[5]
Final Thoughts
Over the short term, markets tend to be sentiment driven because they are driven by people who, in turn, are driven by narratives. Post-pandemic, investors have been lured by the promise of the “metaverse,” which has given way to the frenzy of the AI boom, and tech stocks have been the prime beneficiaries of both.
Over the long term, however, markets are driven by earnings. Still, unfortunately, we don’t possess a crystal ball that can tell us in advance which specific companies, industries, sectors, or geographies will benefit.
The good news is that decades of research have shown that investors can reap the rewards by being broadly diversified and remaining patient. Of course, it’s human nature to want to chase a hot stock story…but the best investing story is the one that sees you achieve your long-term goals and aspirations.
[1] Morningstar Direct, as of May 31, 2023
[2] Morningstar Direct, as of May 31, 2023
[3] Morningstar Direct, as of May 31, 2023
[4] Timiraos, N. (May 31, 2023). Fed Prepares to Skip June Rate Rise but Hike Later. WSJ. https://www.wsj.com/articles/fed-official-says-rate-pause-doesnt-signal-end-to-hikes-758041e5
[5] Phillips, M. (June 1, 2023). The S&P 500’s gains are almost entirely from just five companies. Axios. https://www.axios.com/2023/06/01/sp500-tech-companies-stock-price
Symmetry Partners, LLC, is an investment advisory firm registered with the Securities and Exchange Commission (SEC).
The firm only transacts business in states where it is properly registered or excluded or exempt from registration requirements. Registration with the SEC or any state securities authority does not imply a certain level of skill or training. Different types of investments involve varying degrees of risk, and there can be no assurance that the future performance of any specific investment, investment strategy, product or any non-investment-related content made reference to directly or indirectly in this commentary will be profitable, equal any corresponding indicated historical performance level(s), be suitable for your portfolio or individual situation, or prove successful. Due to various factors, including changing market conditions and/or applicable laws, the content may not be reflective of current opinions or positions. Please note the material is provided for educational and background use only. Moreover, you should not assume that any discussion or information contained in this material serves as the receipt of, or as a substitute for, personalized investment advice. Diversification seeks to improve performance by spreading your investment dollars into various asset classes to add balance to your portfolio. Using this methodology, however, does not guarantee a profit or protection from loss in a declining market. Past performance does not guarantee future results.
Index Disclosure and Definitions All indexes have certain limitations. Investors cannot invest directly in an index. Indexes have no fees. Historical performance results for investment indexes generally do not reflect the deduction of transaction and/or custodial charges or the deduction of an investment management fee, the incurrence of which would have the effect of decreasing historical performance. Actual performance for client accounts may differ materially from the index portfolios.
S&P 500 Index represents the 500 leading U.S. companies, approximately 80% of the total U.S. market capitalization. Dow Jones Industrial Average (DJIA) Is a price-weighted average of 30 significant stocks traded on the New York Stock Exchange (NYSE) and the NASDAQ. The Nasdaq Composite Index (NASDAQ) measures all Nasdaq domestic and international based common-type stocks listed on The Nasdaq Stock Market and includes over 2,500 companies. MSCI World Ex USA GR USD Index captures large and mid-cap representation across 22 of 23 developed markets countries, excluding the U.S. The index covers approximately 85% of the free float-adjusted market capitalization in each country. MSCI Emerging Markets Index is a free float-adjusted market capitalization index that is designed to measure equity market performance in the global emerging markets (as defined by MSCI). The index consists of the 25 emerging market country indexes. Bloomberg U.S. Aggregate Bond Index measures the performance of the U.S. investment grade bond market. The index invests in a wide spectrum of public, investment-grade, taxable, fixed-income securities in the United States—including government, corporate, and international dollar-denominated bonds, as well as mortgage-backed and asset-backed securities, all with maturities of more than 1 year. Bloomberg Global Aggregate (USD Hedged) Index is a flagship measure of global investment grade debt from twenty-four local currency markets. This multi-currency benchmark includes treasury, government-related, corporate and securitized fixed-rate bonds from both developed and emerging market issuers. Index is USD hedged. Stock returns represented by Fama/French Total U.S. Market Research Index, provided by Ken French and available at http://mba.tuck.dartmouth.edu/pages/faculty/ken.french/data_library.html. This value-weighed U.S. market index is constructed every month, using all issues listed on the NYSE, AMEX, or Nasdaq with available outstanding shares and valid prices for that month and the month before. Exclusions: American depositary receipts. Sources: CRSP for value-weighted U.S. market return. Rebalancing: Monthly. Dividends: Reinvested in the paying company until the portfolio is rebalanced.
© Morningstar 2023. All rights reserved. The information contained herein: (1) is proprietary to Morningstar and/or its content providers; (2) may not be copied, adapted, or distributed; and (3) is not warranted to be accurate, complete, or timely. Neither Morningstar nor its content providers are responsible for any damages or losses arising from any use of this information, except where such damages or losses cannot be limited or excluded by law in your jurisdiction. Past financial performance is no guarantee of future results.