

Big Picture
The second quarter of 2022 has been challenging for investors as markets responded negatively to shifting interest rates, supply chain snarls, inflationary pressures, and geopolitical challenges. The sell-off in equities and bonds has been broad and deep, at one point pushing the S&P 500 and NASDAQ down for seven straight weekly losses, the longest such stretch since the dot-com bubble burst, while the Dow Jones Industrial Average slid for eight consecutive weeks, its longest streak since the height of the Great Depression in the 1930s. In June, the S&P 500 punctuated a 3-week losing streak by falling firmly into bear market territory (down over 20% from its all-time high on January 3rd), only to rebound the following week by +6.5% (the 2nd-best weekly return so far in 2022 and one of just two weeks that had a gain in Q2).
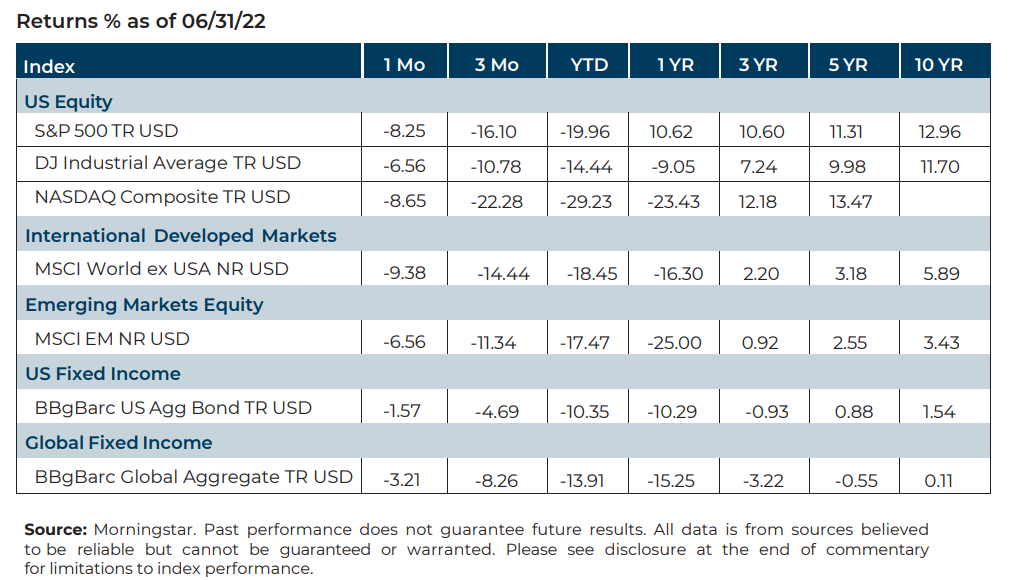
Equities
Despite a strong rally in late June, equity markets faced a turbulent quarter, ending down across the board.
- US. equities posted their worst first-half performance since 1970
- International performance was also down significantly.
- Emerging Market stocks continued to struggle, though slightly less than developed equities.[1]
Fixed income
Fixed income performance for the quarter across markets was firmly down.
- The Bloomberg U.S. Aggregate bond index—predominantly U.S. Treasury’s, highly rated corporate bonds, and mortgage-backed securities—continued to post negative performance.
- The Bloomberg Barclays Global Aggregate Index, representing bonds from both developed and emerging markets, ended down over 8% for the quarter.[2]
Factors
Exposure to investment risk factors was a mixed bag for the quarter. Value and low volatility strategies outperformed, signaling the market's continuing emphasis on defense. Growth and High Beta have been the year's worst performers.[1]
NEWS Impacting Markets
Inflation
U.S. consumer inflation reached its highest level in over four decades, up 8.6% over one year, driven by surging energy prices, which have been the biggest driver of inflation globally this year. While oil and gas prices waned slightly at the end of June, they continue to place upward inflationary pressure on other goods and services.
The Fed
Inflation continues to be the driving force animating the Fed, which responded with a 75 bps rate hike on June 15th, the most significant move in 30 years. Monetary conditions exert enormous influence on stock and bond markets, and market participants remain keenly aware of Fed comments and expectations of future rate increases.
Recession Fears
Economic data (including market performance) and aggressive Fed activity have many market participants nervously watching for signs of a recession. The official definition is now “the period between a peak of economic activity and its subsequent trough, or lowest point,” and its determination involves an ambiguous interpretation of the “depth, diffusion, and duration” of decline in economic activity. Market participants will only be made aware of an official recession when the NBER Business Cycle Dating Committee makes an official determination. Let the navel-gazing begin.
Final Thoughts
Markets are forward-looking systems. They tend to fall in advance of economic turbulence and recessions and start climbing earlier than the economy does. Market returns have tended to be positive during periods of economic recession. Over the past century, returns on U.S. equities have been positive two years after a recession began for 12 of the 16 recorded recessions. Using history as a guide, long-term investors can take some solace in knowing that the optimal strategy has been to endure economic downturns, ignore talk of recessions, and stay focused on maintaining broad-based diversification across geographies, investment vehicles, asset classes, and risk factors.
[1] Morningstar Direct, as of July 1, 2022
[1] Morningstar Direct, as of July 1, 2022
[2] Morningstar Direct, as of July 1, 2022
Symmetry Partners, LLC, is an investment advisory firm registered with the Securities and Exchange Commission (SEC). The firm only transacts business in states where it is properly registered, or excluded or exempt from registration requirements. Registration with the SEC or any state securities authority does not imply a certain level of skill or training. Different types of investments involve varying degrees of risk, and there can be no assurance that the future performance of any specific investment, investment strategy, product or any noninvestment related content made reference to directly or indirectly in this commentary will be profitable, equal any corresponding indicated historical performance level(s), be suitable for your portfolio or individual situation, or prove successful. Due to various factors, including changing market conditions and/or applicable laws, the content may not be reflective of current opinions or positions. Please note the material is provided for educational and background use only. Moreover, you should not assume that any discussion or information contained in this material serves as the receipt of, or as a substitute for, personalized investment advice. Diversification seeks to improve performance by spreading your investment dollars into various asset classes to add balance to your portfolio. Using this methodology, however, does not guarantee a profit or protection from loss in a declining market. Past performance does not guarantee future results.
Index Disclosure and Definitions All indexes have certain limitations. Investors cannot invest directly in an index. Indexes have no fees. Historical performance results for investment indexes generally do not reflect the deduction of transaction and/or custodial charges or the deduction of an investment management fee, the incurrence of which would have the effect of decreasing historical performance. Actual performance for client accounts may differ materially from the index portfolios.
S&P 500 Index represents the 500 leading U.S. companies, approximately 80% of the total U.S. market capitalization. Dow Jones Industrial Average (DJIA) Is a price-weighted average of 30 significant stocks traded on the New York Stock Exchange (NYSE) and the NASDAQ. The Nasdaq Composite Index (NASDAQ) measures all Nasdaq domestic and international based common type stocks listed on The Nasdaq Stock Market, and includes over 2,500 companies. MSCI World Ex USA GR USD Index captures large and mid cap representation across 22 of 23 developed markets countries, excluding the US. The index covers approximately 85% of the free float adjusted market capitalization in each country. MSCI Emerging Markets Index is a free float-adjusted market capitalization index that is designed to measure equity market performance in the global emerging markets (as defined by MSCI). The index consists of the 25 emerging market country indexes. Bloomberg Barclays US Aggregate Bond Index measures the performance of the U.S. investment grade bond market. The index invests in a wide spectrum of public, investment-grade, taxable, fixed income securities in the United States – including government, corporate, and international dollar-denominated bonds, as well as mortgage-backed and assetbacked securities, all with maturities of more than 1 year. Bloomberg Barclays Global Aggregate (USD Hedged) Index is a flagship measure of global investment grade debt from twenty-four local currency markets. This multicurrency benchmark includes treasury, government-related, corporate and securitized fixed-rate bonds from both developed and emerging market issuers. Index is USD hedged.
© Morningstar 2022. All rights reserved. The information contained herein: (1) is proprietary to Morningstar and/ or its content providers; (2) may not be copied, adapted or distributed; and (3) is not warranted to be accurate, complete or timely. Neither Morningstar nor its content providers are responsible for any damages or losses arising from any use of this information, except where such damages or losses cannot be limited or excluded by law in your jurisdiction. Past financial performance is no guarantee of future results
[1] Morningstar Direct, as of July 1, 2022
[1] Morningstar Direct, as of July 1, 2022
[2] Morningstar Direct, as of July 1, 2022