

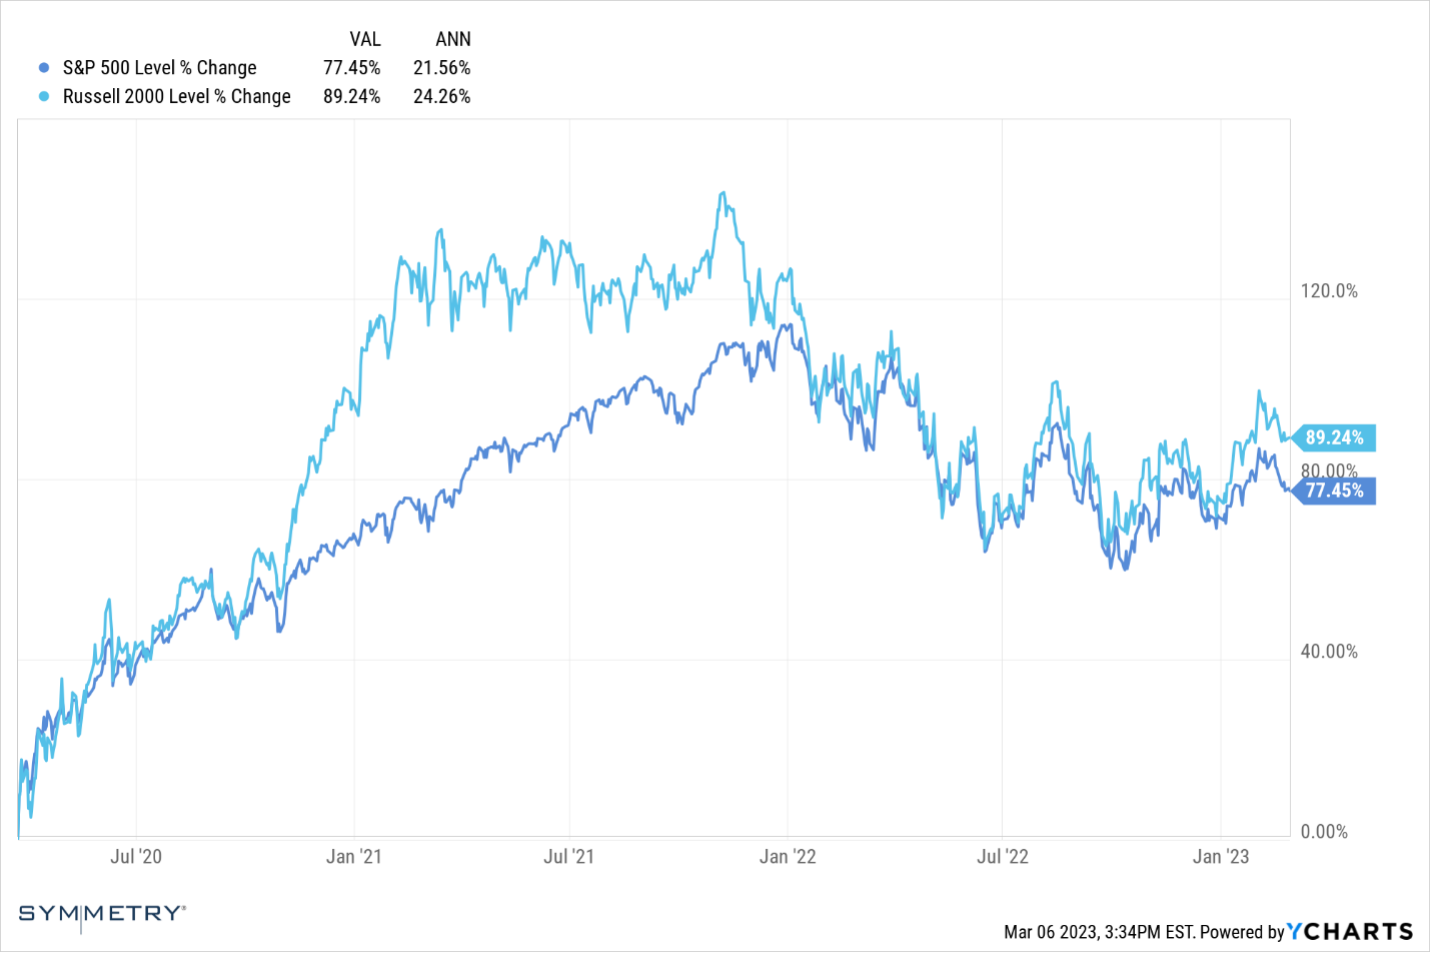
On February 19, 2020, the S&P 500 closed at record highs. However, as concern over the spread of COVID-19 grew, equities quickly started to decline. The selloff soon intensified into a free fall, and the S&P 500 decreased almost 34% in a little over a month, hitting bottom on March 23, 2020. In the three years since, we have watched equities come roaring back, achieving new historic highs, then succumbing to yet another bear market (generally, when a market falls by 20% or more from its most recent high). Still, as you can see on the chart below, through the end of February, the S&P 500 has posted an impressive average annual return of +21.56% since the pandemic market bottom. Yet more impressive is the average annual return of +24.26% posted over the same period by Small Cap stocks (as represented by the Russell 2000). [1]
What Are Small Cap Stocks?
Equities markets are made up of the stocks of thousands of publicly traded companies. One standard metric investors use to evaluate stocks is their market capitalization or the total market value of each company (calculated by multiplying the current stock price by the total number of shares outstanding). Grouping companies by capitalization gives investors an indication of the size and value of a company, the potential risks associated with investing in that company and allows investors to compare companies on an apples-to-apples basis.
Companies are frequently segmented into one of three groups based on their market cap:
- Large Cap Stocks — refer to companies with more than $10 billion market capitalization. A few well-known companies that are large-cap stocks include Amazon (AMZN), JPMorgan Chase (JPM), and Coca-Cola (KO).
- Mid Cap Stocks — company stocks with a market capitalization between $2 billion and $10 billion. A few examples include BJ’s Wholesale Club (BJ), Williams-Sonoma (WSM), and Crocs (CROX).
- Small Cap Stocks — smaller companies typically have a market capitalization ranging from $300 million to $2 billion. Examples of Small Cap companies include Abercrombie & Fitch (ANF), Cheesecake Factory (CAKE), and La-Z-Boy (LZB).
How "Size" Factor Investing Works
In investing, a factor is any characteristic that helps explain an asset's long-term risk and return performance. Investing in specific risk factors has been around for decades and is backed by robust academic findings and empirical results. For example, one of the first risk factors discovered in academic finance, which has been around the longest, is the “size effect.”
The size effect is the phenomenon in which small stocks (i.e., those with lower market capitalizations), on average, outperform large stocks (i.e., those with higher market caps) over time. There are several working theories for why Small Cap stocks deliver positive returns beyond that of Large Cap stocks:
- They offer compensation for an additional risk exposure (risk-based).
- They exploit preferences or beliefs some investors have (behavioral).
- Some combination of risk-based and behavioral rationales.
The size effect can be seen in markets around the globe, and international exposures can help build a better-diversified portfolio that offers a more stable factor return premium because diversification benefits often exist across global equity markets.
Most investors capture the returns associated with factors like the size effect by systematically tilting toward the factor (and away from its polar opposite) and implementing it, either in long-only or long-short portfolios, across a diversified set of assets.
The January Effect
One of the earliest findings about the size effect was that the lion’s share of outperformance occurred in January. This year has been no exception, as the Russell 2000 outperformed the S&P 500 by roughly 3.5% for the month.[2] Several possible reasons for this January effect are year-end tax-loss selling, rebalancing, a cash infusion from investors at the beginning of the year, and window-dressing by mutual fund managers at the turn of the year.
Given the strength of the January effect, it would be understandable for investors to limit exposure to Small Cap stocks. However, research has shown that many other risk factors are more substantial among Small Caps (such as Value & Momentum), and unlocking the total return potential of these factors requires long-term patience in holding Small Caps.
The Bottom Line
Investing in Small Cap stocks is an effective way to diversify a portfolio, gain access to unique opportunities, and potentially outpace the performance of larger companies in the market. The size effect is among the first risk factors identified by academic research. Moreover, it has been shown to complement other factor exposures. With proper research and a balanced approach, adding tilts toward Small Cap investments could be an effective way to diversify and maximize returns for investors.
[1] Source: YCharts, the period shown is 3-23-2000 thru 2-28-2023
[2] Source: YCharts as of 1-31-2023
Symmetry Partners, LLC, provides this communication on this site as a matter of general information. Information contained herein, including data or statistics quoted, are from sources believed to be reliable but cannot be guaranteed or warranted. Due to various factors, including changing market conditions and/or applicable laws, the content may not be reflective of current opinions or positions. All content on this site is for educational purposes and should not be considered investment advice, recommendation or offer of any security for sale. Symmetry Partners does not approve or endorse any third-party communications on this site and will not be liable for any such posts.
Symmetry Partners, LLC is an investment advisory firm registered with the Securities and Exchange Commission (SEC). The firm only transacts business in states where it is properly registered or excluded or exempt from registration requirements. Registration of an investment adviser does not imply any specific level of skill or training and does not constitute an endorsement of the firm by the Commission.
A copy of Symmetry Partners, LLC current written disclosure brochure filed with the SEC which discusses among other things, Symmetry Partners, LLC business practices, services and fees, is available through the SEC's website at: www.adviserinfo.sec.gov.
Investing involves risk, including the loss of some or all of your principal. Diversification seeks to reduce volatility by spreading your investment dollars into various asset classes to add balance to your portfolio. Using this methodology, however, does not guarantee a profit or protection from loss in a declining market.
Risk Disclosure - Higher potential return generally involves greater risk, short-term volatility is not uncommon when investing in various types of funds including but not limited to: sector, emerging markets, small and mid-cap funds. International investing involves special risks such as currency fluctuation, lower liquidity, political and economic uncertainties, and differences in accounting standards, which risks are generally intensified for investments in emerging markets due to the relatively smaller size and lesser liquidity of these markets, high inflation rates and adverse political developments. Risks for investing in international equity include foreign currency risk, as well as, fluctuation due to economic or political actions of foreign governments and/or less regulated or liquid markets. Risks for smaller companies include business risks, significant stock price fluctuation and illiquidity. Investing in real estate entails certain risks, including changes in: the economy, supply and demand, laws, tenant turnover, interest rates (including periods of high interest rates), availability of mortgage funds, operation expenses and cost of insurance.
Index Disclosure and Definitions - All indexes have certain limitations. Investors cannot invest directly in an index. Indexes have no fees. Historical performance results for investment indexes generally do not reflect the deduction of transaction and/or custodial charges or the deduction of an investment management fee, the incurrence of which would have the effect of decreasing historical performance. Actual performance for client accounts may differ materially from the index portfolios.
S&P 500 Index represents the 500 leading U.S. companies, approximately 80% of the total U.S. market capitalization. Dow Jones Industrial Average (DJIA) Is a price-weighted average of 30 significant stocks traded on the New York Stock Exchange (NYSE) and the NASDAQ. The Nasdaq Composite Index (NASDAQ) measures all Nasdaq domestic and international based common type stocks listed on The Nasdaq Stock Market, and includes over 2,500 companies. MSCI World Ex USA GR USD Index captures large and mid cap representation across 22 of 23 developed markets countries, excluding the US. The index covers approximately 85% of the free float-adjusted market capitalization in each country. MSCI Emerging Markets Index is a free float-adjusted market capitalization index that is designed to measure equity market performance in the global emerging markets (as defined by MSCI). The index consists of the 25 emerging market country indexes. Bloomberg Barclays US Aggregate Bond Index measures the performance of the U.S. investment grade bond market. The index invests in a wide spectrum of public, investment-grade, taxable, fixed income securities in the United States – including government, corporate, and international dollar-denominated bonds, as well as mortgage-backed and asset-backed securities, all with maturities of more than 1 year. Bloomberg Barclays Global Aggregate (USD Hedged) Index is a flagship measure of global investment grade debt from twenty-four local currency markets. This multi-currency benchmark includes treasury, government-related, corporate and securitized fixed-rate bonds from both developed and emerging market issuers. Index is USD hedged.
© Morningstar 2023. All rights reserved. The information contained herein: (1) is proprietary to Morningstar and/or its content providers; (2) may not be copied, adapted or distributed; and (3) is not warranted to be accurate, complete or timely. Neither Morningstar nor its content providers are responsible for any damages or losses arising from any use of this information, except where such damages or losses cannot be limited or excluded by law in your jurisdiction. Past financial performance is no guarantee of future results.