
-5.png)
Big Picture
April brought a wave of economic uncertainty, as market participants grappled with worries about rising inflation levels while banking sector struggles remained unresolved (as evidenced by the demise of First Republic Bank). However, better-than-expected Q1 earnings results, led by American tech giants, helped prevent stock markets from heading into free-fall and provided temporary stability despite concerns over future monetary policy decisions.
Equities
Despite heightened anxiety, stocks managed to post positive performance.
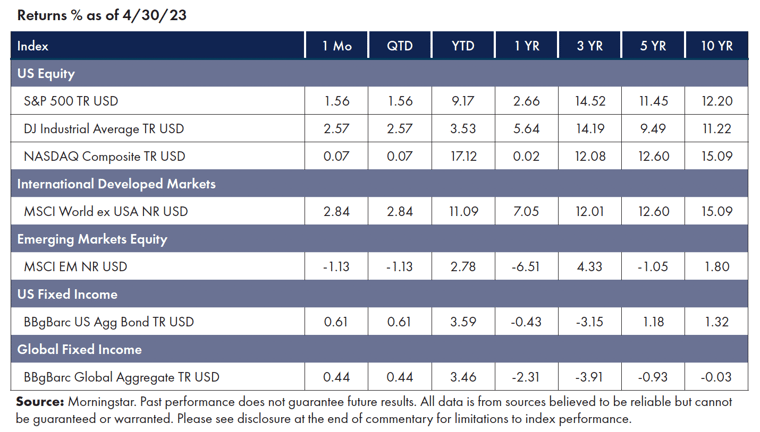
- A stretch of solid earnings from some of the biggest U.S. corporations helped push all three major U.S. indexes higher for the month.
- Despite a fluctuating market, there were silver linings to be found as Livestock and Precious Metals experienced an upswing, whereas Energy, Agriculture, and Industrial Metals saw declines.[1]
Fixed Income
The mayhem of March’s bank failures fueled turbulent swings in short-term Treasury yields, reverberating across bond markets a month later.
- Trading volumes have mostly returned to normal, but risk appetites have not.
- Despite that, most fixed-income indices continued to post gains.[2]
Factors
Risk factors have been a mixed bag for the month. In the U.S., Momentum, Quality, and Minimum Volatility led, while Value, Momentum, and Minimum Volatility outperformed in International Developed markets. In Emerging Markets, most factors outperformed market beta.[3]
NEWS Impacting Markets
The Economy, Inflation, and The Fed
Although economic data showed signs of improvement, the U.S. economy only grew at an unsatisfactory 1.1% in Q1—falling short of expectations for a 2% growth rate and far off from its preceding quarter's expansion figure. Meanwhile, the growth rate in the core personal consumption expenditure (PCE) index slowed to a 4.6% rate in March but remained well above the Federal Reserve's 2% target.
However, the Fed’s preferred measure of underlying inflation, the personal consumption expenditures price index excluding food and energy, has continued to rise. As does the Labor Department’s measure of employment costs, which increased 1.2% in the first quarter from the previous period, exceeding forecasts. The ongoing rise in PCE (ex-food and energy) and labor costs suggests that Fed policymakers will continue to raise their benchmark interest rate at the next meeting (early May).[4]
Banks
The bank failures of March continued reverberating across the banking sector, claiming yet another bank by the end of April. After suffering over $100 billion in outflows, regulators were forced to step in and orchestrate JPMorgan Chase’s acquisition of First Republic Bank in the third major bank failure over the past two months, ranking as the second-largest seizure of a financial institution in U.S. history.
All $92 billion of deposits are safe and secure; however, shareholders and bondholders will be wiped out. As a result, the FDIC did not need to invoke its systemic risk exception for this buyout, which was necessary with other recent takeovers.[5]
Final Thoughts
The recent economic and inflation numbers have given rise to whispers of stagflation, slow growth accompanied by inflation. Market participants would do well to revisit a similar historical period, the 1970s and early 1980s.
As shown in the chart below, while the economic environment was challenging (including several recessions), markets adjusted to the news and incorporated it into prices, then resumed rewarding long-term investors who were willing to put capital to work patiently. The market is not the economy. Focus on your goals, be patient, and harvest the potential long-term rewards.
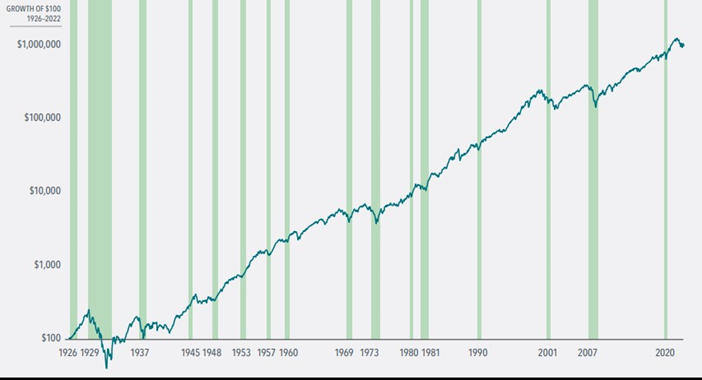
Source: Dimensional. Growth of wealth shows the growth of a hypothetical investment of $100 in the securities in the Fama/French U.S. Total Market Research Index from July 1926 through December 2022. Gross Domestic Product (GDP) based on quarterly data from the US Bureau of Economic Analysis; quarterly data not available prior to 1947. Percentage change in GDP based on business cycle peak to trough quarter as reported by the National Bureau of Economic Research (NBER). Industrial Production, Inflation, and Unemployment based on monthly data from Federal Reserve Bank of St. Louis (FRED); Unemployment data not reported prior to 1929.
[1] Morningstar Direct, as of April 30, 2023
[2] Bahceli, Y. (April 28, 2023). World’s biggest bond markets left picking up the pieces after March mayhem. Reuters. www.reuters.com/markets/rates-bonds/worlds-biggest-bond-markets-left-picking-up-pieces-after-march-mayhem-2023-04-28
[3] Morningstar Direct, as of April 30, 2023
[4] Pickert, R. (April 28, 2023). U.S. Inflation Pressures Persist, Reinforcing Case for Fed Hike. Bloomberg. www.bloomberg.com/news/articles/2023-04-28/us-core-pce-inflation-stays-brisk-while-consumer-spending-stalls
[5] Masters, B. (May 1, 2023). JPMorgan to acquire First Republic’s deposits as U.S. regulators step in. FT. www.ft.com/content/0c61a540-e6be-4bca-8054-841d9983756b
Symmetry Partners, LLC, is an investment advisory firm registered with the Securities and Exchange Commission (SEC).
The firm only transacts business in states where it is properly registered, or excluded or exempt from registration requirements. Registration with the SEC or any state securities authority does not imply a certain level of skill or training. Different types of investments involve varying degrees of risk, and there can be no assurance that the future performance of any specific investment, investment strategy, product or any non- investment related content made reference to directly or indirectly in this commentary will be profitable, equal any corresponding indicated historical performance level(s), be suitable for your portfolio or individual situation, or prove successful. Due to various factors, including changing market conditions and/or applicable laws, the content may not be reflective of current opinions or positions. Please note the material is provided for educational and background use only. Moreover, you should not assume that any discussion or information contained in this material serves as the receipt of, or as a substitute for, personalized investment advice. Diversification seeks to improve performance by spreading your investment dollars into various asset classes to add balance to your portfolio. Using this methodology, however, does not guarantee a profit or protection from loss in a declining market. Past performance does not guarantee future results.
Index Disclosure and Definitions All indexes have certain limitations. Investors cannot invest directly in an index. Indexes have no fees. Historical performance results for investment indexes generally do not reflect the deduction of transaction and/or custodial charges or the deduction of an investment management fee, the incurrence of which would have the effect of decreasing historical performance. Actual performance for client accounts may differ materially from the index portfolios.
S&P 500 Index represents the 500 leading U.S. companies, approximately 80% of the total U.S. market capitalization. Dow Jones Industrial Average (DJIA) Is a price-weighted average of 30 significant stocks traded on the New York Stock Exchange (NYSE) and the NASDAQ. The Nasdaq Composite Index (NASDAQ) measures all Nasdaq domestic and international based common type stocks listed on The Nasdaq Stock Market, and includes over 2,500 companies. MSCI World Ex USA GR USD Index captures large and mid cap representation across 22 of 23 developed markets countries, excluding the US. The index covers approximately 85% of the free float-adjusted market capitalization in each country. MSCI Emerging Markets Index is a free float-adjusted market capitalization index that is designed to measure equity market performance in the global emerging markets (as defined by MSCI). The index consists of the 25 emerging market country indexes. Bloomberg US Aggregate Bond Index measures the performance of the U.S. investment grade bond market. The index invests in a wide spectrum of public, investment-grade, taxable, fixed income securities in the United States – including government, corporate, and international dollar-denominated bonds, as well as mortgage-backed and asset-backed securities, all with maturities of more than 1 year. Bloomberg Global Aggregate (USD Hedged) Index is a flagship measure of global investment grade debt from twenty-four local currency markets. This multi-currency benchmark includes treasury, government-related, corporate and securitized fixed-rate bonds from both developed and emerging market issuers. Index is USD hedged.
© Morningstar 2023. All rights reserved. The information contained herein: (1) is proprietary to Morningstar and/or its content providers; (2) may not be copied, adapted or distributed; and (3) is not warranted to be accurate, complete or timely. Neither Morningstar nor its content providers are responsible for any damages or losses arising from any use of this information, except where such damages or losses cannot be limited or excluded by law in your jurisdiction. Past financial performance is no guarantee of future results.