
-5.png)
Big Picture
Markets were off and running with a solid start to the year, then came a slew of economic data in February that showed more robust growth and a possible second wave of inflation, and markets promptly sold off on heightened fears that central banks In both the U.S. and Europe will have to push interest rates higher, and possibly keep them there longer, with effects that will ripple around the globe.
Equities
Stocks staged a reversal from January’s sizzling performance.
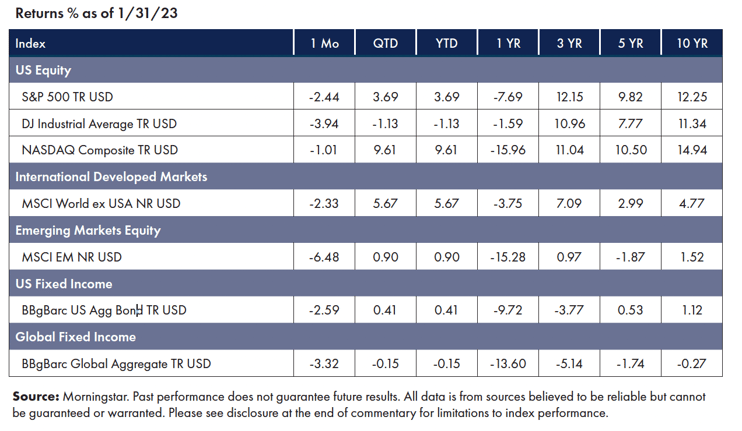
• In US markets, technology stocks were the lone positive sector, with energy stocks the worst-performing.
• International developed stocks were depressed by the same macro forces and ended the month down
• Emerging Market stocks suffered from a flight to quality and ended the month down.1
Fixed Income
Bonds also responded negatively to economic data, and yields rose steadily over February.
•The Bloomberg US Aggregate Bond Index, or the “Agg,” finished down on the month.
•The Bloomberg Global Aggregate Index, representing bonds from both developed and emerging markets, also ended down for the month.2
Factors
Risk factors have been a mixed bag for the month as risk assets, in general, have struggled. In the U.S., small-cap stocks continued their relatively good start to the year, and the Size factor has been a positive contributor, as has Quality. In International Developed markets, Value and Momentum have outperformed, and in Emerging Markets, the majority of factor exposure held up better than market beta.3
NEWS Impacting Markets
Inflation
At the end of last year, rolling in January, market participants gravitated around the narrative that price pressures are on a steady glide path downward, and a soft landing is in sight. The higher-than-expected January CPI number and other economic data, including a monster jobs report in January and higher-than-expected Retail Sales and US Producer Prices reports, have served as a poignant reminder that the crowd often gets ahead of the data (often with unpleasant consequences). Since November, the Fed has focused on a narrower measure of the price of services excluding energy and housing, dubbed “supercore inflation,” to guide interest-rate policy. Unfortunately, this measure of inflation is still elevated and potentially moving in the wrong direction, suggesting the Fed will remain hawkish for some time.4
Jobs
The Bureau of Labor Statistics reported that nonfarm employment doubled expectations in January, adding 517,000, while the unemployment rate fell to 3.4%—the lowest jobless level since 1969. The report’s strength sent shockwaves through markets and was a turning point for the year’s early run of promising returns. As a result, equities markets began to sell off on the outlook that the Fed will need to continue pushing rates higher, and bond markets were quick to respond, with yields shooting up sharply for the month.5
Housing
While inflation, jobs, and consumer spending continue at a healthy pace, elevated interest rates have caused U.S. existing-home sales to fall for over 12 months. In February, the Mortgage Bankers Association’s weekly purchase index, a measure of applications for mortgages, dropped to its lowest level since 1995. According to Redfin, the total value of the U.S. Housing market decreased by $2.3 trillion, or 4.9%, between June and December, the most since 2008. The most significant declines were in pricey cities such as San Francisco and New York.6
Final Thoughts
The strength across consumer spending, the job market, and inflation at the start of the year have confounded market participants’ expectations and are feeding fears that the Federal Reserve may ultimately need to continue raising rates and hold them higher for longer to tame inflation. For much of last year, stock and bond prices were pushed down as financial markets were roiled by tighter monetary policy. That pattern was broken the previous few months thru January, but it returned with a vengeance in February.
Investors are encouraged to stay patient through such market downturns and volatility. Half of the S&P 500’s best days in the past 20 years have occurred during such markets. Miss just a few of those, and the negative impact on long-term returns can be significant, as the best 10 days over the past 20 years accounted for over 75% of the overall return for the period!7
1 Morningstar Direct, as of Feb 28, 2023
2 Morningstar Direct, as of Feb 28, 2023
3 Morningstar Direct, as of Feb 28, 2023
4 Source: U.S. Bureau of Labor Statistics Consumer Price Index, Jan 2023
5 Source: U.S. Bureau of Labor Statistics Current Employment Statistics Jan 2023
6 Source: Mortgage Bankers Association Weekly Application Survey, Feb 22, 2023
7 Source: J.P. Morgan Asset Management analysis using data from Bloomberg. Returns are based on the S&P 500 Total Return Index, an unmanaged, capitalization-weighted index that measures the performance of 500 large capitalization domestic stocks representing all major industries. Indices do not include fees or operating expenses and are not available for actual investment. Data as of December 31, 2021.
Symmetry Partners, LLC, is an investment advisory firm registered with the Securities and Exchange Commission (SEC).
The firm only transacts business in states where it is properly registered, or excluded or exempt from registration requirements. Registration with the SEC or any state securities authority does not imply a certain level of skill or training. Different types of investments involve varying degrees of risk, and there can be no assurance that the future performance of any specific investment, investment strategy, product or any non- investment related content made reference to directly or indirectly in this commentary will be profitable, equal any corresponding indicated historical performance level(s), be suitable for your portfolio or individual situation, or prove successful. Due to various factors, including changing market conditions and/or applicable laws, the content may not be reflective of current opinions or positions. Please note the material is provided for educational and background use only. Moreover, you should not assume that any discussion or information contained in this material serves as the receipt of, or as a substitute for, personalized investment advice. Diversification seeks to improve performance by spreading your investment dollars into various asset classes to add balance to your portfolio. Using this methodology, however, does not guarantee a profit or protection from loss in a declining market. Past performance does not guarantee future results.
Index Disclosure and Definitions All indexes have certain limitations. Investors cannot invest directly in an index. Indexes have no fees. Historical performance results for investment indexes generally do not reflect the deduction of transaction and/or custodial charges or the deduction of an investment management fee, the incurrence of which would have the effect of decreasing historical performance. Actual performance for client accounts may differ materially from the index portfolios.
S&P 500 Index represents the 500 leading U.S. companies, approximately 80% of the total U.S. market capitalization. Dow Jones Industrial Average (DJIA) Is a price-weighted average of 30 significant stocks traded on the New York Stock Exchange (NYSE) and the NASDAQ. The Nasdaq Composite Index (NASDAQ) measures all Nasdaq domestic and international based common type stocks listed on The Nasdaq Stock Market, and includes over 2,500 companies. MSCI World Ex USA GR USD Index captures large and mid cap representation across 22 of 23 developed markets countries, excluding the US. The index covers approximately 85% of the free float-adjusted market capitalization in each country. MSCI Emerging Markets Index is a free float-adjusted market capitalization index that is designed to measure equity market performance in the global emerging markets (as defined by MSCI). The index consists of the 25 emerging market country indexes. Bloomberg Barclays US Aggregate Bond Index measures the performance of the U.S. investment grade bond market. The index invests in a wide spectrum of public, investment-grade, taxable, fixed income securities in the United States – including government, corporate, and international dollar-denominated bonds, as well as mortgage-backed and asset-backed securities, all with maturities of more than 1 year. Bloomberg Barclays Global Aggregate (USD Hedged) Index is a flagship measure of global investment grade debt from twenty-four local currency markets. This multi-currency benchmark includes treasury, government-related, corporate and securitized fixed-rate bonds from both developed and emerging market issuers. Index is USD hedged.
© Morningstar 2023. All rights reserved. The information contained herein: (1) is proprietary to Morningstar and/or its content providers; (2) may not be copied, adapted or distributed; and (3) is not warranted to be accurate, complete or timely. Neither Morningstar nor its content providers are responsible for any damages or losses arising from any use of this information, except where such damages or losses cannot be limited or excluded by law in your jurisdiction. Past financial performance is no guarantee of future results.