
-5.png)
Big Picture
February was a strong month for equities markets, particularly in the United States. The three major U.S. indexes posted their most significant gains since 2023, even as January’s inflation data raised new questions about when the Federal Reserve might start cutting interest rates.
It was also a big month for bond issuance, with U.S. companies selling at least $172 billion of debt. In general, the pace of total issuance in 2024 has surpassed previous records, fueled by the rebound in mergers and acquisitions activity from 2023, the slowest year for dealmaking in a decade.
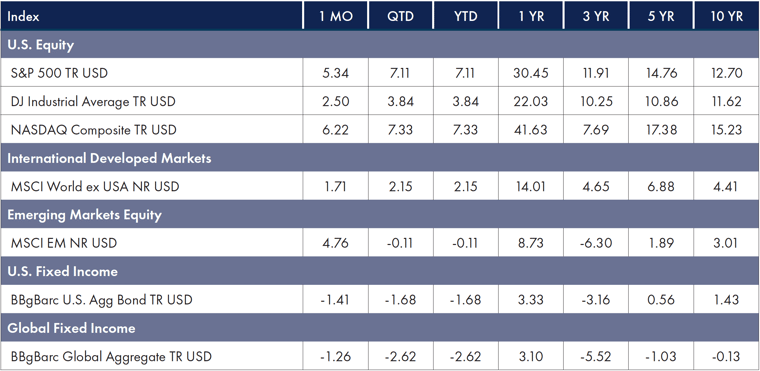
Returns % as of 2/29/24
 Source: Morningstar. Past performance does not guarantee future results. All data is from sources believed to be reliable but cannot
be guaranteed or warranted. Please see disclosure at the end of commentary for limitations to index performance.
Equity
Equity markets were a mixed bag.
- The S&P 500 closed up 5.17% to a record of 5096.27, its 14th record close this year.
- The NASDAQ Composite ended the month up 6.12% at 16091.92, a record close and its first record close this year.
- The DJ Industrial Average closed up 2.23% in February to 38996.39. The fourth-highest close ever.1
- The S&P 500 concentration hit a new high as the top 10 holdings account for 33% of the index.2
Fixed Income
Consumer Price Index/Personal Consumption Expenditures (CPI/PCE) results for January resulted in yields climbing and the 2s10s inversion widening back to –39 basis points.
- Treasuries enjoyed an end-of-February rally, and benchmark yields are holding near the highest levels in more than three months.
- The Bloomberg US Aggregate Bond Index, a widely tracked measure of total returns on U.S. fixed income, finished down –1.41%.
- International debt followed U.S. markets, though to a greater degree, and the Bloomberg Global Aggregate Bond Index finished the month down –1.26%.3
Factors
Equity risk factors were a mixed bag for the month. Momentum and Quality have continued a hot start for the year, demonstrating significant outperformance across all markets. Size rebounded in the United States, though it continues to lag in internationally developed and emerging markets.4
News Impacting Markets
The Economy, Inflation & the Fed
Data for January has shown U.S. inflation easing less than expected. The Fed’s preferred inflation metric, core PCE, rose 0.4% in January from the previous month. While it aligned with expectations, it suggests the central bank will need to wait longer before cutting interest rates.5
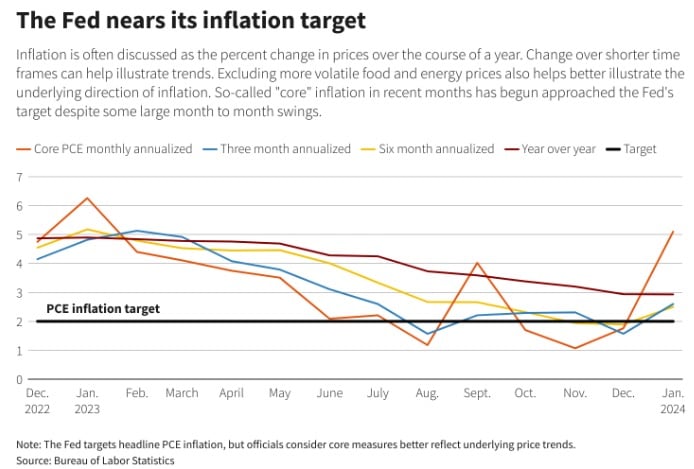
While the likelihood of a rate cut in March has all but been eliminated, implied futures suggest the odds of a rate cut in May have fallen from 50% to 30%, and the odds of a rate cut in June stand at 65%. Members of the Federal Open Market Committee (FOMC) have stated that they are keeping an eye on the data, and while they anticipate the central bank beginning to cut rates in the summer, it could be a “bumpy” ride.6
M7 & AI
The “Magnificent Seven stocks have driven the S&P 500’s recent rally, outpacing their counterparts significantly with a 90% rise since the start of 2023. This surge can be credited to the rise of generative artificial intelligence (AI), a technological advancement that has propelled investor interest and manifested in tangible revenue and earnings growth. These seven stocks have reported a 15% year-on-year revenue growth for the fourth quarter and are projected to maintain an annual sales growth rate of 12% through 2026.
Investors’ fascination with AI compounds the tech rally, providing continuous momentum. This is evidenced by Dell Technologies’ recent entry and its booming demand for AI servers, as well as the positive surprises brought about by established AI players such as C3.ai and Nvidia.
However, heightened interest in AI amplifies risks for companies in this sphere. Snowflake and SoundHound learned this the hard way, with both companies’ shares dropping around 20% post-earnings due to disappointing guidance.
As tech stocks continue to swing wildly, the buzz and hype surrounding AI could be a double-edged sword, posing a potential threat to the rally’s sustainability if companies fail to exceed expectations.
Final Thoughts
Benjamin Graham was an investor, financial writer, and long-time professor at Columbia University (where he helped shape the minds of notable subtends, like Warrant Buffet). He is known as the “father of value investing.” One of his most profound insights is that “in the short run, the market is a voting machine, but in the long run, it is a weighing machine.”
In today’s market, where information is near instantaneous, tech-powered competition is aggressive, and trade execution is measured in milliseconds. Short-run “voting” takes the form of institutional players unleashing algorithms designed to chase “alpha” by executing short-term trading strategies.
Algorithmic trading now accounts for roughly 60% to 75% of overall trading volume in the United States, European, and Asian markets. Individual investors trying to pick stocks are in the minority and face tough competition.
You may be right about the outcome of an event (quarterly earnings, Fed rate decisions, who wins the Superbowl, etc.), but that doesn’t guarantee that the algobots haven’t already discerned the opportunity, traded away the alpha, and bid up the investment to reflect the outcome before you can fully press a button.
Far too many investors are losing this game.
On the other hand, investors willing to patiently tip the odds of Graham’s long-run weighing machine in their favor are winning the game of “time arbitrage.”
Time is the key differentiator—keep it on your side.
1 Morningstar Direct, February 29, 2024
2 MarketDesk. Analysis is based on SPY ETF
3 Morningstar Direct as of February 29, 2024
4 Morningstar Direct, February 29, 2024
5 Authers, J., “The Fed Wasn’t Going to Cut Rates Soon, Anyway,” Bloomberg.com, March 1, 2024, https://www.bloomberg.com/opinion/articles/2024-03-01/pce-inflation-gives-fed-no-reason-to-rush-rate-cuts
6 Duguid, K. & Clarfelt, H., “U.S. Stocks Drop and Treasury Yields Jump as Inflation Data Shakes Rate Bets, FT, February 13, 2024, https://www.ft.com/content/de014155-5d85-4f45-9bcf-46f1619ceef9
The firm only transacts business in states where it is properly registered or excluded or exempt from registration requirements. Registration with the SEC or any state securities authority does not imply a certain level of skill or training. Different types of investments involve varying degrees of risk, and there can be no assurance that the future performance of any specific investment, investment strategy, product or any non-investment-related content made reference to directly or indirectly in this commentary will be profitable, equal any corresponding indicated historical performance level(s), be suitable for your portfolio or individual situation, or prove successful. Due to various factors, including changing market conditions and/or applicable laws, the content may not be reflective of current opinions or positions. Please note the material is provided for educational and background use only. Moreover, you should not assume that any discussion or information contained in this material serves as the receipt of, or as a substitute for, personalized investment advice. Diversification seeks to improve performance by spreading your investment dollars into various asset classes to add balance to your portfolio. Using this methodology, however, does not guarantee a profit or protection from loss in a declining market. Past performance does not guarantee future results.
Index Disclosure and Definitions All indexes have certain limitations. Investors cannot invest directly in an index. Indexes have no fees. Historical performance results for investment indexes generally do not reflect the deduction of transaction and/or custodial charges or the deduction of an investment management fee, the incurrence of which would have the effect of decreasing historical performance. Actual performance for client accounts may differ materially from the index portfolios.
S&P 500 Index represents the 500 leading U.S. companies, approximately 80% of the total U.S. market capitalization. Dow Jones Industrial Average (DJIA) Is a price-weighted average of 30 significant stocks traded on the New York Stock Exchange (NYSE) and the NASDAQ. The Nasdaq Composite Index (NASDAQ) measures all Nasdaq domestic and international based common-type stocks listed on The Nasdaq Stock Market and includes over 2,500 companies. MSCI World Ex USA GR USD Index captures large and mid-cap representation across 22 of 23 developed markets countries, excluding the U.S. The index covers approximately 85% of the free float-adjusted market capitalization in each country. MSCI Emerging Markets Index is a free float-adjusted market capitalization index that is designed to measure equity market performance in the global emerging markets (as defined by MSCI). The index consists of the 25 emerging market country indexes. Bloomberg U.S. Aggregate Bond Index measures the performance of the U.S. investment grade bond market. The index invests in a wide spectrum of public, investment-grade, taxable, fixed-income securities in the United States—including government, corporate, and international dollar-denominated bonds, as well as mortgage-backed and asset-backed securities, all with maturities of more than 1 year. Bloomberg Global Aggregate (USD Hedged) Index is a flagship measure of global investment grade debt from twenty-four local currency markets. This multi-currency benchmark includes treasury, government-related, corporate and securitized fixed-rate bonds from both developed and emerging market issuers. Index is USD hedged. Stock returns represented by Fama/French Total U.S. Market Research Index, provided by Ken French and available at http://mba.tuck.dartmouth.edu/pages/faculty/ken.french/data_library.html. This value-weighed U.S. market index is constructed every month, using all issues listed on the NYSE, AMEX, or Nasdaq with available outstanding shares and valid prices for that month and the month before. Exclusions: American depositary receipts. Sources: CRSP for value-weighted U.S. market return. Rebalancing: Monthly. Dividends: Reinvested in the paying company until the portfolio is rebalanced.
© Morningstar 2023. All rights reserved. The information contained herein: (1) is proprietary to Morningstar and/or its content providers; (2) may not be copied, adapted, or distributed; and (3) is not warranted to be accurate, complete, or timely. Neither Morningstar nor its content providers are responsible for any damages or losses arising from any use of this information, except where such damages or losses cannot be limited or excluded by law in your jurisdiction. Past financial performance is no guarantee of future results.