
-5.png)
Big Picture
Thanks to positive economic data fueling expectations that the Federal Reserve has successfully defanged inflation without sending the economy into a recession, surging optimism that the Fed is done hiking rates spread across markets in November. U.S. stocks posted one of the best Novembers since the 1980s, while a plunge in yields helped bond markets rally to finish with one of the best months since 1985. Meanwhile, despite OPEC+ deepening its production cuts to keep oil prices firm, a surplus of production in the United States has helped drive oil and gasoline prices down.
Equities
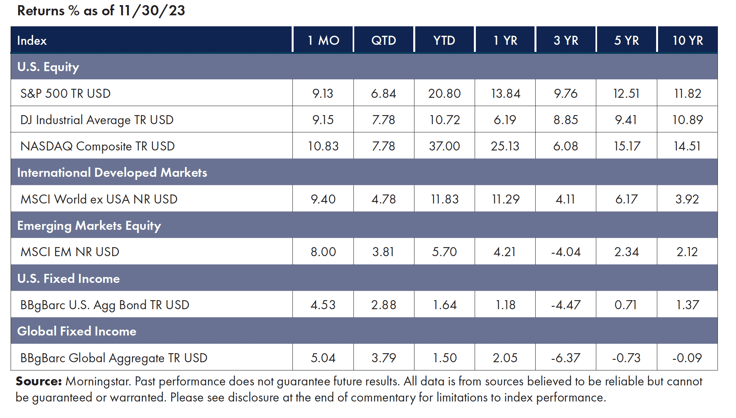
Equity markets rebounded from a rough October to post a sensational November.
- The S&P 500, Dow, and NASDAQ all advanced over 9%.
- Global stocks had one of their biggest monthly rallies in three years. International Developed Markets were up over 9%, and Emerging Markets were up 8%.
- Information Technology led all sectors, with Energy the only sector in the red.
- Precious metals were up, while commodities like corn have tumbled to three-year lows.1
Fixed Income
Bond prices surged as yields dropped, driving the best monthly performance for bond markets in nearly four decades.
- The yield on the 10-year Treasury note plunged from almost 5% in October to 4.27% by the end of November.
- The Bloomberg U.S. Aggregate bond index, a widely tracked measure of total returns on U.S. fixed income, posted its best month since 1985.
- International debt followed U.S. markets, and the Bloomberg Global Aggregate bond index posted its best month since the financial crisis in 2008.2
Factors
Equity risk factors participated in the upswing in markets on an absolute basis. On a relative basis, when compared to the general market, Momentum was a slight outperformer in the United States, Momentum and Quality outperformed in International Developed markets, and Size and Quality exceeded in Emerging Markets.3
News Impacting Markets
The Economy, Inflation & the Fed
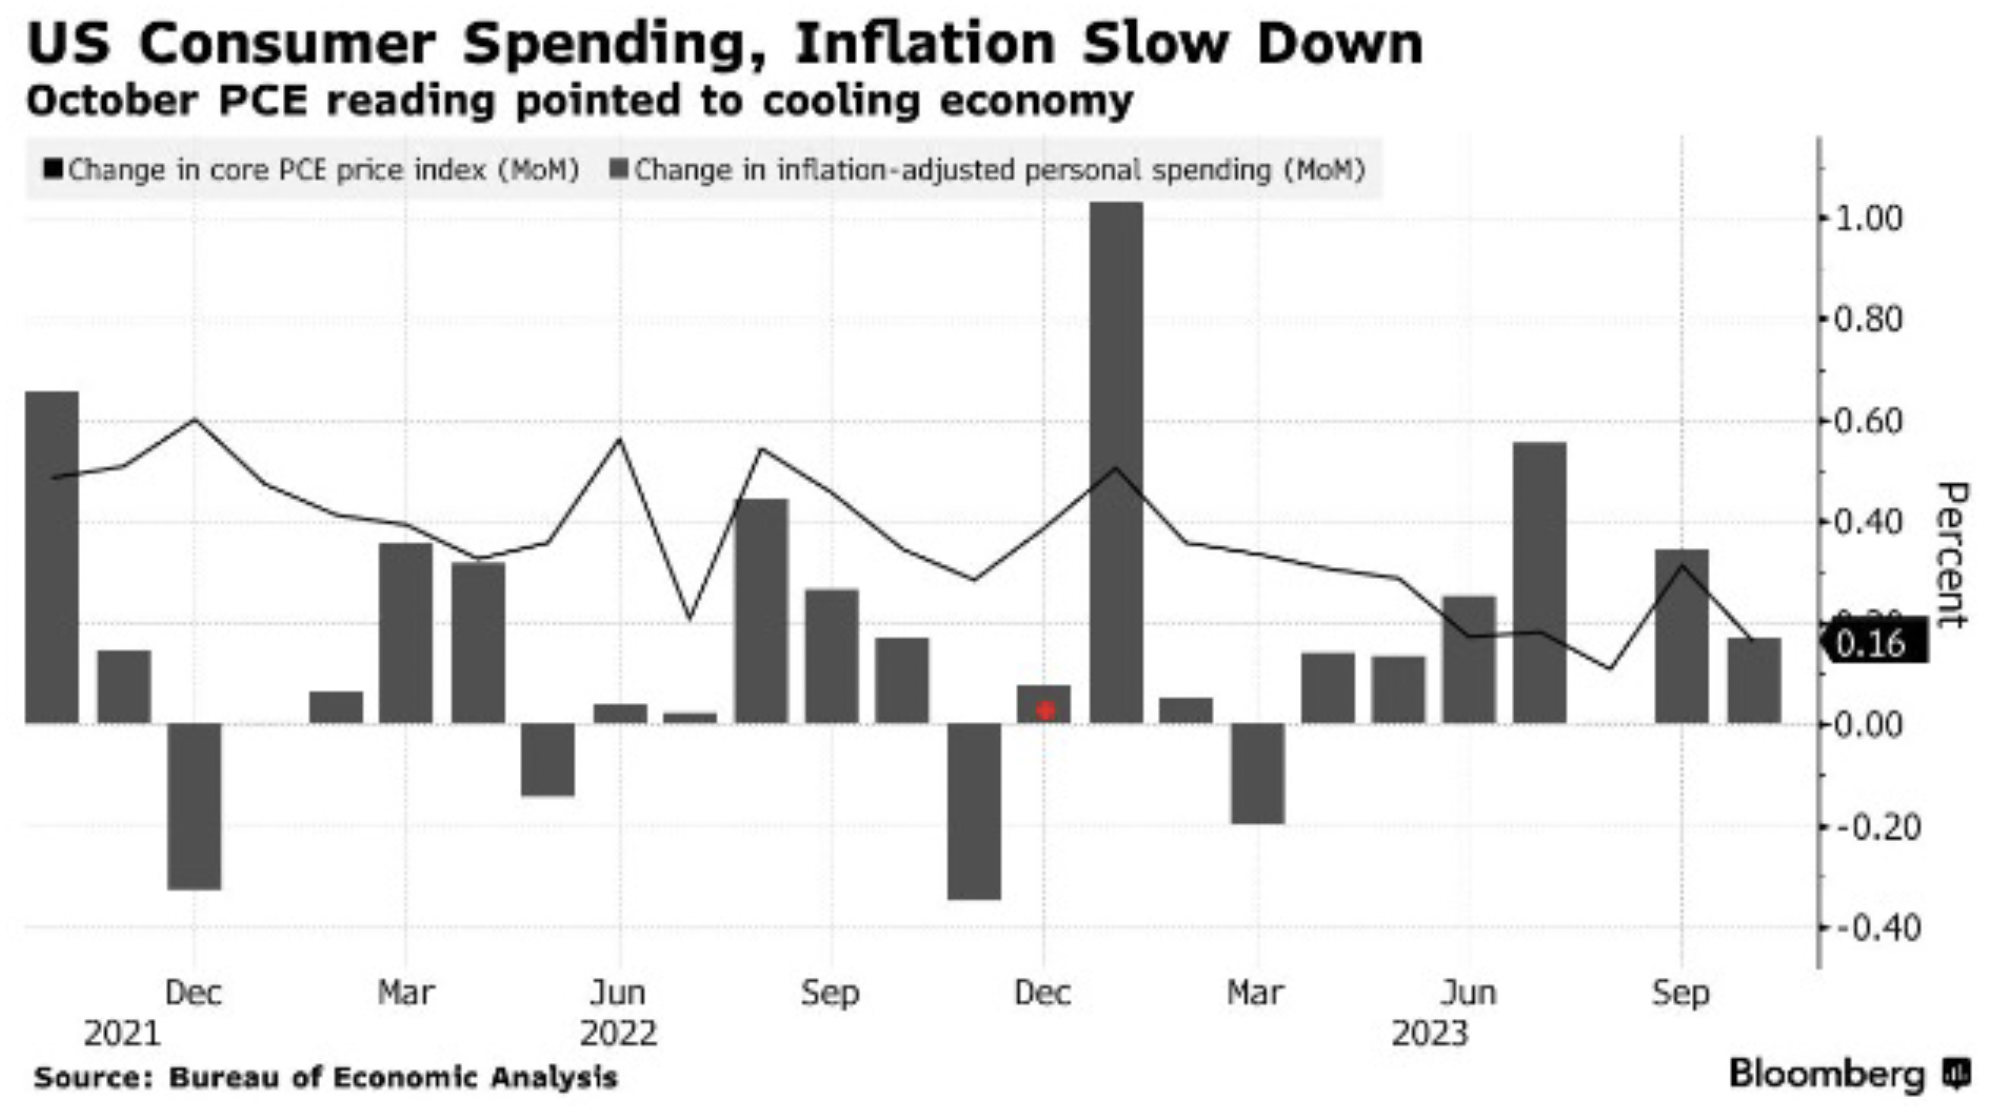
Recent economic data suggest the economy is slowing, as U.S. consumer spending, inflation, and the labor market have all cooled.
Inflation has significantly slowed down this year, suggesting that the Fed may end its interest rate increases. Price growth, as measured by the personal consumption expenditures price index (the Fed’s preferred inflation gauge), remained mild in October. Headline PCE fell to an annualized rate of 3% from 3.4% in September, while the “core” personal consumption expenditure index, which excludes volatile items, decreased to an annualized rate of 3.5% in October, down from 3.7% in September, reaching its lowest point in over two years.4
Federal Reserve Chair Jerome Powell suggested that the U.S. central bank might have completed its rate hikes, the most aggressive tightening cycle in four decades after the FOMC voted to keep interest rates unchanged for the second consecutive policy meeting in early November.
2024 Prognostications
It’s that time of year on Wall Street when economists and analysts do their best to predict what lies ahead in the next year. The ritual publications of Wall Street forecasts offer insights into widely held views on expectations.
Consensus opinion points to a slowdown in the economy and inflation in 2024, with the possibility of the Fed cutting rates by the end of the year. Futures suggest that traders don’t see strong chances of a cut in January, but they have priced in a 48% chance of a quarter-point reduction in March. A month ago, those odds were at 14%.5
Opinions about what this means for stocks and bonds diverge sharply, but most analysts are projecting a flat muddle-through year.
It’s important to note that these predictions may not necessarily turn out to be accurate. They are more often wrong than right. Recall that heading into 2023, the average forecast called for the S&P 500 to decline (it’s up over 20%).
Yet, it’s worth noting that some of the most pessimistic predictions stemmed from valid expectations: the Fed’s unexpectedly aggressive actions caused yields to skyrocket to unprecedented levels. Surprisingly, the anticipated recession never materialized, corporate profits remained solid, and U.S. consumers continued to spend. Also, the explosive growth of artificial intelligence (AI) sparked a new wave of excitement for tech companies that powered stock prices higher.
This points to the exceedingly tricky challenge of successfully predicting the course of economic events—and successfully predicting how markets will respond to those events. Investors are better served to build portfolios based on long-standing empirical evidence and avoid crystal ball gazing.
In the words of the late Charlie Munger, “Knowing what you don’t know is more useful than being brilliant.”
Final Thoughts
The dominant story of the last several years has been the impact of COVID. We’ve experienced the fallout of a once-in-a-century pandemic everywhere across the economy, all around the world. The fading of the initial shock explains the initial inflation surge, which resulted in aggressive central bank action that has roiled markets.
We look forward to turning the page as the economy (and markets) settle into something resembling normality in the new year.
Wishing you health and happiness this holiday season.
1 Morningstar Direct as of November 30, 2023
2 Morningstar Direct as of November 30, 2023
3 Morningstar Direct as of November 30, 2023
4 Saraiva, A., “U.S. Consumer Spending, Inflation Slow in Sign of Cooling Economy, Bloomberg.com, November 30, 2023, https://www.bloomberg.com/news/articles/2023-11-30/us-consumer-spending-inflation-slow-in-sign-of-cooling-economy
5 CME FedWatch Tool https://www.cmegroup.com/markets/interest-rates/cme-fedwatch-tool.html
Symmetry Partners, LLC, is an investment advisory firm registered with the Securities and Exchange Commission (SEC).
The firm only transacts business in states where it is properly registered or excluded or exempt from registration requirements. Registration with the SEC or any state securities authority does not imply a certain level of skill or training. Different types of investments involve varying degrees of risk, and there can be no assurance that the future performance of any specific investment, investment strategy, product or any non-investment-related content made reference to directly or indirectly in this commentary will be profitable, equal any corresponding indicated historical performance level(s), be suitable for your portfolio or individual situation, or prove successful. Due to various factors, including changing market conditions and/or applicable laws, the content may not be reflective of current opinions or positions. Please note the material is provided for educational and background use only. Moreover, you should not assume that any discussion or information contained in this material serves as the receipt of, or as a substitute for, personalized investment advice. Diversification seeks to improve performance by spreading your investment dollars into various asset classes to add balance to your portfolio. Using this methodology, however, does not guarantee a profit or protection from loss in a declining market. Past performance does not guarantee future results.
Index Disclosure and Definitions All indexes have certain limitations. Investors cannot invest directly in an index. Indexes have no fees. Historical performance results for investment indexes generally do not reflect the deduction of transaction and/or custodial charges or the deduction of an investment management fee, the incurrence of which would have the effect of decreasing historical performance. Actual performance for client accounts may differ materially from the index portfolios.
S&P 500 Index represents the 500 leading U.S. companies, approximately 80% of the total U.S. market capitalization. Dow Jones Industrial Average (DJIA) Is a price-weighted average of 30 significant stocks traded on the New York Stock Exchange (NYSE) and the NASDAQ. The Nasdaq Composite Index (NASDAQ) measures all Nasdaq domestic and international based common-type stocks listed on The Nasdaq Stock Market and includes over 2,500 companies. MSCI World Ex USA GR USD Index captures large and mid-cap representation across 22 of 23 developed markets countries, excluding the U.S. The index covers approximately 85% of the free float-adjusted market capitalization in each country. MSCI Emerging Markets Index is a free float-adjusted market capitalization index that is designed to measure equity market performance in the global emerging markets (as defined by MSCI). The index consists of the 25 emerging market country indexes. Bloomberg U.S. Aggregate Bond Index measures the performance of the U.S. investment grade bond market. The index invests in a wide spectrum of public, investment-grade, taxable, fixed-income securities in the United States—including government, corporate, and international dollar-denominated bonds, as well as mortgage-backed and asset-backed securities, all with maturities of more than 1 year. Bloomberg Global Aggregate (USD Hedged) Index is a flagship measure of global investment grade debt from twenty-four local currency markets. This multi-currency benchmark includes treasury, government-related, corporate and securitized fixed-rate bonds from both developed and emerging market issuers. Index is USD hedged. Stock returns represented by Fama/French Total U.S. Market Research Index, provided by Ken French and available at http://mba.tuck.dartmouth.edu/pages/faculty/ken.french/data_library.html. This value-weighed U.S. market index is constructed every month, using all issues listed on the NYSE, AMEX, or Nasdaq with available outstanding shares and valid prices for that month and the month before. Exclusions: American depositary receipts. Sources: CRSP for value-weighted U.S. market return. Rebalancing: Monthly. Dividends: Reinvested in the paying company until the portfolio is rebalanced.
© Morningstar 2023. All rights reserved. The information contained herein: (1) is proprietary to Morningstar and/or its content providers; (2) may not be copied, adapted, or distributed; and (3) is not warranted to be accurate, complete, or timely. Neither Morningstar nor its content providers are responsible for any damages or losses arising from any use of this information, except where such damages or losses cannot be limited or excluded by law in your jurisdiction. Past financial performance is no guarantee of future results.