
-5.png)
Big Picture
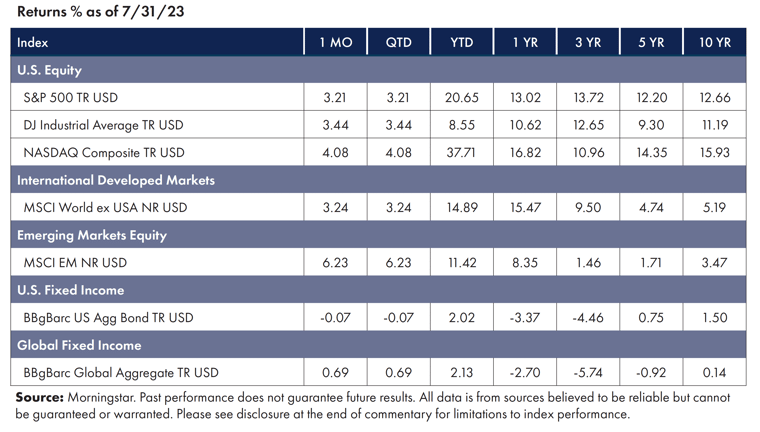
The strong performance of markets over the first half of the year continued through July. All three major indexes had a good month, with the NASDAQ up 4%, the S&P 500 up 3.2%, and the Dow up 3.44%. For much of the year, the increase in markets was driven by the “magnificent seven”—Alphabet, Amazon, Apple, Meta, Microsoft, Nvidia, and Tesla. That began to change in June, and price gains continued to broaden over July, particularly within small-caps and emerging market equities. The Fed resumed raising rates in July, but economic data has strengthened market participants’ view that a “soft landing” is in sight.
Equities
The market rally of the first half continued in July, and market breadth continued to widen.
- The S&P 500 rose for a fifth straight month; the Dow was up 13 days in a row, the longest streak since 1987; the NASDAQ had its best January-to-July since 1975.
- Small-caps outperformed large, and emerging markets outperformed domestic markets.
- All 11 sectors of the S&P 500 were up for the month, led by Energy, which staged a strong reversal from the prior quarter’s losses. [1]
Fixed Income
Fixed-income markets were split between “soft-landing” optimism and likely further Fed rate hike pessimism.
- Yields on longer-dated Treasuries climbed in July, while the shorter-dated have been roughly unchanged.
- Demand for high-grade corporate debt has been strong, as investors are eager to lock in yields above 5%.
- The 2Y-10Y hit its deepest inversion point in early July but had flattened by 20 bps by the month's end. [2]
Factors
July was a risk-on environment, and risk factors were up. Value and Size outperformed across all markets, with the addition of Momentum leading in emerging markets. [3]
NEWS Impacting Markets
The Fed - Endgame?
After skipping a rate increase in June to assess the effects of its aggressive monetary tightening over the prior year, the Federal Reserve resumed lifting rates at its July meeting with a quarter of a percentage point hike and left the door open for additional increases.
However, a change in the wording of the Federal Open Market Committee post-meeting statement suggested that the Fed is now taking a more upbeat view of the economy, and for good reason.
In June, the annual U.S. inflation rate experienced its slowest growth in over two years. This favorable inflation trend was supported by additional data indicating minimal increases in labor costs during the second quarter as wage growth cooled. This aligns with reports of the economy transitioning into a disinflation phase, characterized by significant moderation in consumer prices and muted producer inflation.
Slowing inflationary pressures and the labor market’s resilience, which supports consumer spending, have fostered cautious optimism among market participants for a “soft landing” of the economy.
Fingers crossed.
Final Thoughts
Markets are up. That’s great. This time last year, they were down. Significantly.
It’s natural to experience both good and bad years in investing. Market conditions, asset classes, styles, strategies, and geographical factors all contribute to variations in returns.
It’s crucial to maintain some perspective when considering the implications of returns, good or bad, over the short run.
If we take a look at the experience of a long-term investor by using rolling 30-year returns on the S&P 500 since 1950 (the blue line on the chart below) and compare that to the short-term ups and downs of the S&P 500 each year for the last 30 years (the orange bars), we can gain valuable insights.
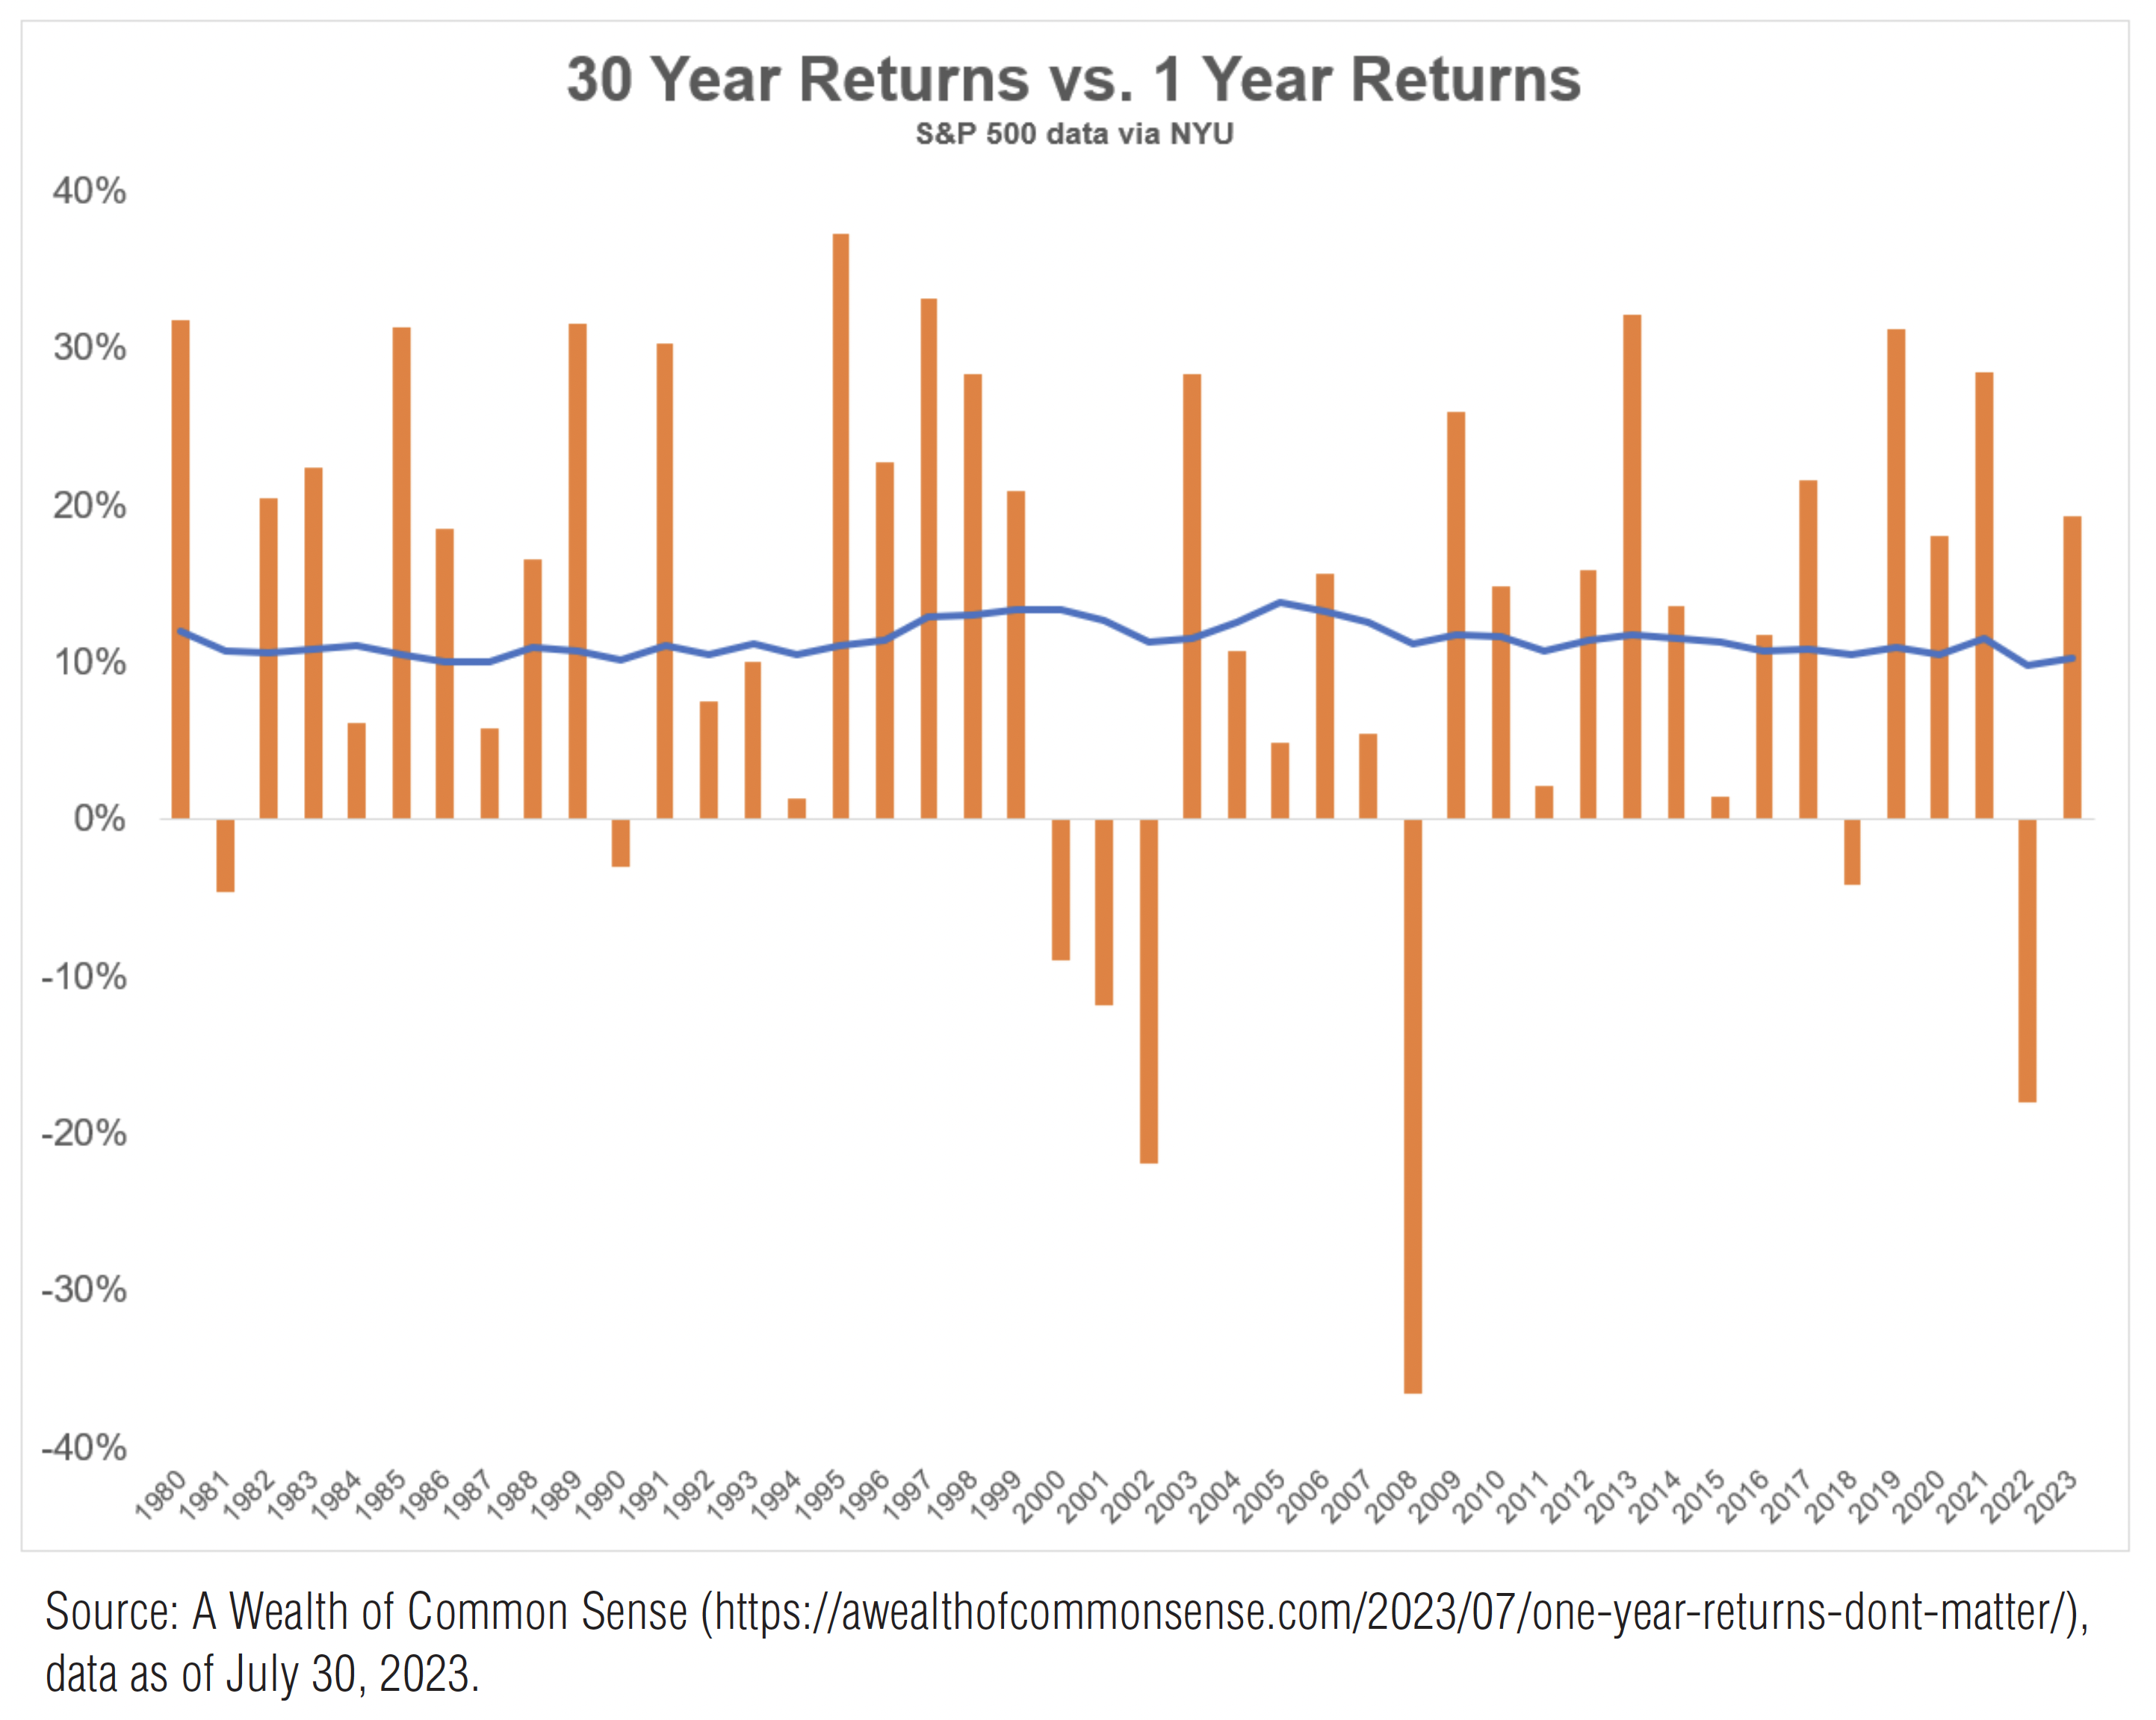
One-year returns may evoke excitement or disappointment, but they have a limited impact on long-term results. While returns fluctuate significantly every year, long-term returns remain relatively stable.
There will always be some reason for concern on the near horizon. However, it’s important to recognize that long-term results are the most significant consideration for long-term investment success.
1 Morningstar Direct, as of July 31, 2023
2 Morningstar Direct, as of July 31, 2023
3 Morningstar Direct, as of July 31, 2023
Symmetry Partners, LLC, is an investment advisory firm registered with the Securities and Exchange Commission (SEC).
The firm only transacts business in states where it is properly registered or excluded or exempt from registration requirements. Registration with the SEC or any state securities authority does not imply a certain level of skill or training. Different types of investments involve varying degrees of risk, and there can be no assurance that the future performance of any specific investment, investment strategy, product or any non-investment-related content made reference to directly or indirectly in this commentary will be profitable, equal any corresponding indicated historical performance level(s), be suitable for your portfolio or individual situation, or prove successful. Due to various factors, including changing market conditions and/or applicable laws, the content may not be reflective of current opinions or positions. Please note the material is provided for educational and background use only. Moreover, you should not assume that any discussion or information contained in this material serves as the receipt of, or as a substitute for, personalized investment advice. Diversification seeks to improve performance by spreading your investment dollars into various asset classes to add balance to your portfolio. Using this methodology, however, does not guarantee a profit or protection from loss in a declining market. Past performance does not guarantee future results.
Index Disclosure and Definitions All indexes have certain limitations. Investors cannot invest directly in an index. Indexes have no fees. Historical performance results for investment indexes generally do not reflect the deduction of transaction and/or custodial charges or the deduction of an investment management fee, the incurrence of which would have the effect of decreasing historical performance. Actual performance for client accounts may differ materially from the index portfolios.
S&P 500 Index represents the 500 leading U.S. companies, approximately 80% of the total U.S. market capitalization. Dow Jones Industrial Average (DJIA) Is a price-weighted average of 30 significant stocks traded on the New York Stock Exchange (NYSE) and the NASDAQ. The Nasdaq Composite Index (NASDAQ) measures all Nasdaq domestic and international based common-type stocks listed on The Nasdaq Stock Market and includes over 2,500 companies. MSCI World Ex USA GR USD Index captures large and mid-cap representation across 22 of 23 developed markets countries, excluding the U.S. The index covers approximately 85% of the free float-adjusted market capitalization in each country. MSCI Emerging Markets Index is a free float-adjusted market capitalization index that is designed to measure equity market performance in the global emerging markets (as defined by MSCI). The index consists of the 25 emerging market country indexes. Bloomberg U.S. Aggregate Bond Index measures the performance of the U.S. investment grade bond market. The index invests in a wide spectrum of public, investment-grade, taxable, fixed-income securities in the United States—including government, corporate, and international dollar-denominated bonds, as well as mortgage-backed and asset-backed securities, all with maturities of more than 1 year. Bloomberg Global Aggregate (USD Hedged) Index is a flagship measure of global investment grade debt from twenty-four local currency markets. This multi-currency benchmark includes treasury, government-related, corporate and securitized fixed-rate bonds from both developed and emerging market issuers. Index is USD hedged. Stock returns represented by Fama/French Total U.S. Market Research Index, provided by Ken French and available at http://mba.tuck.dartmouth.edu/pages/faculty/ken.french/data_library.html. This value-weighed U.S. market index is constructed every month, using all issues listed on the NYSE, AMEX, or Nasdaq with available outstanding shares and valid prices for that month and the month before. Exclusions: American depositary receipts. Sources: CRSP for value-weighted U.S. market return. Rebalancing: Monthly. Dividends: Reinvested in the paying company until the portfolio is rebalanced.
© Morningstar 2023. All rights reserved. The information contained herein: (1) is proprietary to Morningstar and/or its content providers; (2) may not be copied, adapted, or distributed; and (3) is not warranted to be accurate, complete, or timely. Neither Morningstar nor its content providers are responsible for any damages or losses arising from any use of this information, except where such damages or losses cannot be limited or excluded by law in your jurisdiction. Past financial performance is no guarantee of future results.