
-5.png)
Big Picture
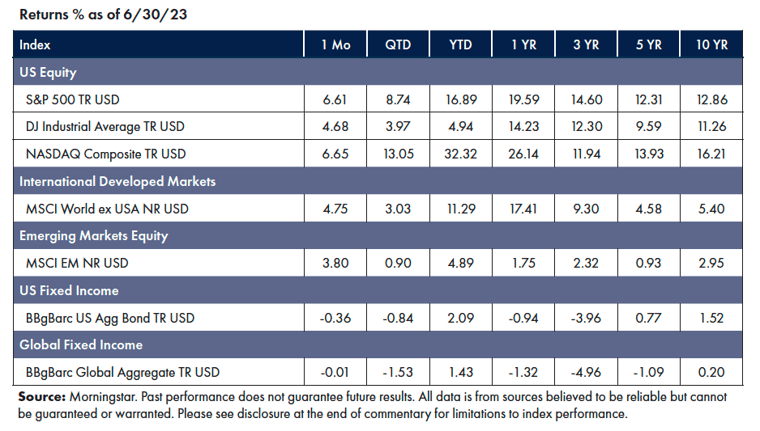
Despite a somewhat lackluster April and May, equities markets ended one of the better first halves of a year in quite some time by the end of June. The Nasdaq, S&P 500, and Dow were up 32.32%, 16.89%, and 4.94% for the year, respectively. It was the Nasdaq’s best first half of a year since 1983, primarily due to growth in tech stocks driven by the surge in AI.
Market participants have become more confident that the economy is strong enough to shrug off the historic pace of rate hikes, banking system troubles, and stubborn inflation data. However, that suggests the Fed will have to keep rates higher for a more extended period and bond markets sold off.
Equities
The market’s narrow rally of the first half, dominated by a handful of tech stocks, broadened in June.
- The Nasdaq finished up over 30% YTD for its best first half in 40 years, while the S&P 500 had its best first half since 2019.
- Market breadth turned strongly positive in June.
- All 11 sectors of the S&P were up for the month, led by Consumer Discretionary (+12.07%), while Information Technology led for the half (+42.77%) [1]
Fixed Income
Yields rebounded in June as strains from bank failures and the debt-ceiling crisis eased.
- Futures markets have traders pricing in an 87% chance of the Fed raising rates in July, and the target rate will finish the year above current levels (i.e., no rate cuts).
- Expectations of ongoing rate increases in the near future have floated the short end of the curve, with the two-year moving up 50 bps in June.
- The two-year to 10-year yield curve hit its deepest inversion since 1981. [2]
Factors
As usual, returns associated with risk factors have been a mixed bag. In the United States, both Size and Momentum outperformed for the month of June; while in International Developed Markets, Value and Momentum led; and in Emerging Markets, Value and Size have continued to outperform. [3]
NEWS Impacting Markets
The Economy, Inflation, and The Fed
Resilient economic data (stronger than anticipated growth coupled with historically low unemployment) has reignited talk of a potential “soft landing.” Meanwhile, headline inflation continues to cool slowly, but core prices, which exclude food and energy, have remained sticky. The Fed’s preferred inflation gauge, the core personal consumption expenditures price index (PCE), increased in May by 4.6% from a year earlier. This almost assures that the Fed will pick up from June’s interest-rate hike pause with several more rate increases starting in July. [4]
Tech Giants Have Roared... But the Rest of the Market May Finally Be Catching Up
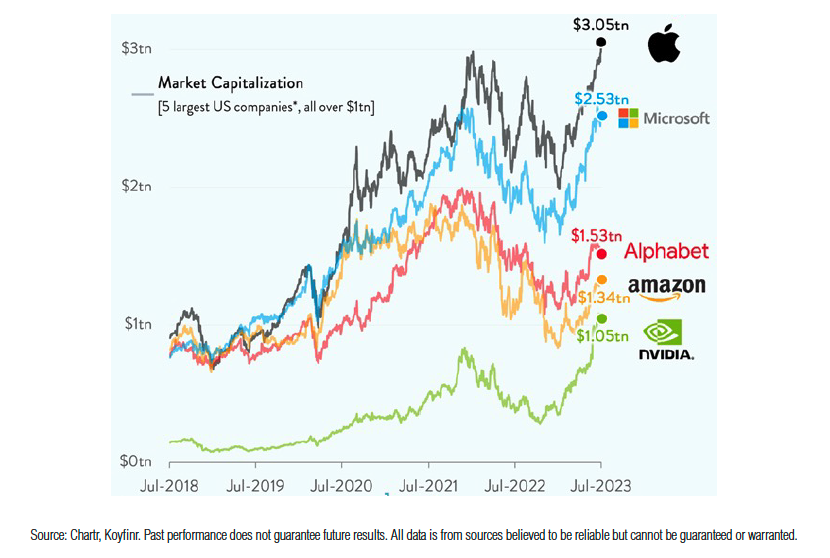
Until June, the largest tech companies by size were responsible for most of the stock market’s 2023 gains. Alphabet (Google), Amazon, Apple, Meta, Microsoft, Nvidia, and Tesla have all experienced a significant surge in their share prices. Apple closed the month of June with a share price that made it the first company in history to be valued at over $3 trillion, while Nvidia’s shares have tripled in six months, propelling them into $1 trillion club. However, the June equity market rally was broad-based. Shares of 454 companies in the S&P 500 were up, with 155 up at least 10%. The rally also expanded to include mid- and small-cap stocks and equities from international and emerging markets. [5]
Final Thoughts
The whiplash investors have experienced, from the exceedingly poor performance across stock and bond markets in 2022 to the healthy rebound in the first half of 2023, is a study of the benefits of being a patient investor. Time and again, we see studies that point to the “average” performance of investors lagging behind the performance of the markets. Much of the root cause of that underperformance is attributable to investors making the wrong move at the wrong time—either chasing good performance or fleeing from bad.
What does the second half of 2023 hold for investors? No one knows. But we do know that over time markets reward patience. Sit tight and try to enjoy the ride.
1 Morningstar Direct, as of June 30, 2023
2 Morningstar Direct, as of June 30, 2023
3 Morningstar Direct, as of June 30, 2023. Global Factor data based on MSCI Indices.
4 Robles, C. & Cambon, S. C. (2023, June 29). U.S. Economy Shows Surprising Vigor in First Half of 2023. WSJ.
5 S&P Dow Jones Performance Report, U.S. Equities June 2023
Symmetry Partners, LLC, is an investment advisory firm registered with the Securities and Exchange Commission (SEC).
The firm only transacts business in states where it is properly registered or excluded or exempt from registration requirements. Registration with the SEC or any state securities authority does not imply a certain level of skill or training. Different types of investments involve varying degrees of risk, and there can be no assurance that the future performance of any specific investment, investment strategy, product or any non-investment-related content made reference to directly or indirectly in this commentary will be profitable, equal any corresponding indicated historical performance level(s), be suitable for your portfolio or individual situation, or prove successful. Due to various factors, including changing market conditions and/or applicable laws, the content may not be reflective of current opinions or positions. Please note the material is provided for educational and background use only. Moreover, you should not assume that any discussion or information contained in this material serves as the receipt of, or as a substitute for, personalized investment advice. Diversification seeks to improve performance by spreading your investment dollars into various asset classes to add balance to your portfolio. Using this methodology, however, does not guarantee a profit or protection from loss in a declining market. Past performance does not guarantee future results.
Index Disclosure and Definitions All indexes have certain limitations. Investors cannot invest directly in an index. Indexes have no fees. Historical performance results for investment indexes generally do not reflect the deduction of transaction and/or custodial charges or the deduction of an investment management fee, the incurrence of which would have the effect of decreasing historical performance. Actual performance for client accounts may differ materially from the index portfolios.
S&P 500 Index represents the 500 leading U.S. companies, approximately 80% of the total U.S. market capitalization. Dow Jones Industrial Average (DJIA) Is a price-weighted average of 30 significant stocks traded on the New York Stock Exchange (NYSE) and the NASDAQ. The Nasdaq Composite Index (NASDAQ) measures all Nasdaq domestic and international based common-type stocks listed on The Nasdaq Stock Market and includes over 2,500 companies. MSCI World Ex USA GR USD Index captures large and mid-cap representation across 22 of 23 developed markets countries, excluding the U.S. The index covers approximately 85% of the free float-adjusted market capitalization in each country. MSCI Emerging Markets Index is a free float-adjusted market capitalization index that is designed to measure equity market performance in the global emerging markets (as defined by MSCI). The index consists of the 25 emerging market country indexes. Bloomberg U.S. Aggregate Bond Index measures the performance of the U.S. investment grade bond market. The index invests in a wide spectrum of public, investment-grade, taxable, fixed-income securities in the United States—including government, corporate, and international dollar-denominated bonds, as well as mortgage-backed and asset-backed securities, all with maturities of more than 1 year. Bloomberg Global Aggregate (USD Hedged) Index is a flagship measure of global investment grade debt from twenty-four local currency markets. This multi-currency benchmark includes treasury, government-related, corporate and securitized fixed-rate bonds from both developed and emerging market issuers. Index is USD hedged. Stock returns represented by Fama/French Total U.S. Market Research Index, provided by Ken French and available at http://mba.tuck.dartmouth.edu/pages/faculty/ken.french/data_library.html. This value-weighed U.S. market index is constructed every month, using all issues listed on the NYSE, AMEX, or Nasdaq with available outstanding shares and valid prices for that month and the month before. Exclusions: American depositary receipts. Sources: CRSP for value-weighted U.S. market return. Rebalancing: Monthly. Dividends: Reinvested in the paying company until the portfolio is rebalanced.
© Morningstar 2023. All rights reserved. The information contained herein: (1) is proprietary to Morningstar and/or its content providers; (2) may not be copied, adapted, or distributed; and (3) is not warranted to be accurate, complete, or timely. Neither Morningstar nor its content providers are responsible for any damages or losses arising from any use of this information, except where such damages or losses cannot be limited or excluded by law in your jurisdiction. Past financial performance is no guarantee of future results.