
-5.png)
Big Picture
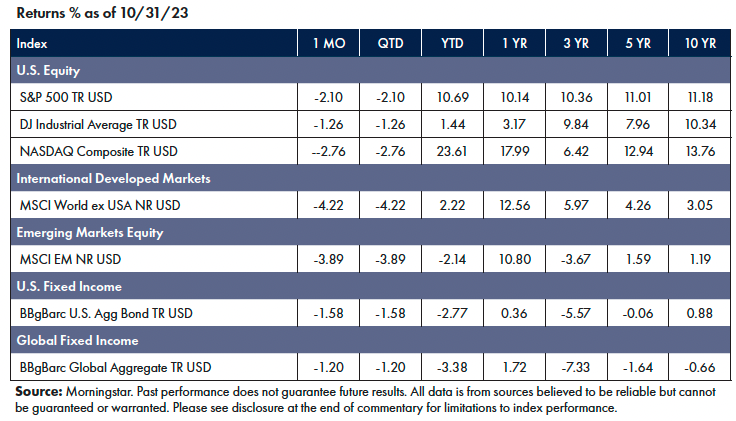
Over the past decade, October has been among the best-performing months of the year, with the S&P 500 rising an average of 2.3% (according to FactSet data). However, this October, equities markets had their worst performance in years, and the market malaise of the past few months continued. All three major equity indexes had a negative month, with the NASDAQ down -2.76%, the S&P 500 down -2.10%, and the DJ Industrial Average down -1.26%.
While global equity markets are still up for the year, the recent downturn has some wondering if the bull market of the first half was actually a bear market rally in disguise or if it simply ran out of steam due to recent mixed earnings results, surging Treasury yields, geopolitical tensions, and uncertainty surrounding the Federal Reserve’s future rate trajectory.
Equities
Equity markets visited correction territory in October.
- On August 1, the NASDAQ was up 37.71% and the S&P 500 was up 20.65%. The recent slide has trimmed those gains significantly.
- International and Emerging markets fared a little better, with the latter turning negative for the year.
- Utilities were the only sector in positive territory for the month, while Precious Metals and Agriculture led the way among Commodities.1
Fixed Income
The historic bear market in fixed income continued for another month.
- Ten-year U.S. Treasury yields crossed the symbolically significant 5% mark.
- Wild swings in the “world’s safest asset” are driving volatility across global markets.
- Corporate bonds have also taken a beating, primarily due to the effect of rising interest rates and not the movement in credit spreads.2
Factors
Equity risk factor performance varied across markets. Momentum, Quality, and Minimum Volatility were relative outperformers in the United States and International Developed markets. Quality and Minimum Volatility positively contributed to Emerging Markets.3
NEWS Impacting Markets
The Economy, Inflation & the Fed
Economic growth has been surprisingly strong, with the gross domestic product (GDP) growing seasonally and at an inflation-adjusted 4.9% annual rate in the third quarter, according to the U.S. Department of Commerce.4
One of the main reasons cited for such robust growth has been stepped-up spending by U.S. consumers, defying expectations they would pull back due to a series of interest rate hikes from the Federal Reserve aimed at cooling inflation by slowing the economy.
With the ongoing strength in consumer demand, the Fed will be closely watching to see if that translates to further tightening in the labor market, which could resume inflationary wage pressures.
Some Fed members have suggested that the swift rise in long-term interest rates in bonds over the past month may effectively substitute for Fed rate rises. So, the Fed will hold rates steady in the range of 5.25% to 5.5% for now, but officials will likely keep the door open to another hike in December or beyond.
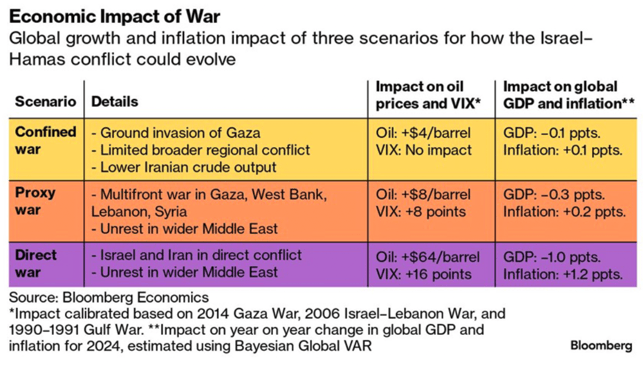
War in the Middle East
War broke in the aftermath of the Palestinian militant group Hamas firing thousands of rockets toward Israeli towns on October 7, 2023, while launching an unprecedented surprise cross-border raid from Gaza, killing more than 1,400 people and taking hundreds of hostages. Following the attack, Israel declared war and launched a series of reprisals.
The conflict has the potential to expand beyond Hamas and Israel, disrupting the region, particularly if it leads to direct confrontation with Iranian proxies (such as Hezbollah in Lebanon) or Iran itself. Such an escalation could disrupt the world economy and tip it into recession if the price of oil is significantly impacted (see chart on the next page).5
Oil
Russia’s war in Ukraine and the recent outbreak of violence in the Middle East have demonstrated the fragility of world energy markets, underscoring the importance of domestic production for the United States. Recently announced mega-mergers have the potential to reshape the U.S. oil industry on a scale that hasn’t been seen in decades.
ExxonMobil is buying Pioneer for $64.5 billion, including debt, while Chevron is acquiring Hess for $60 billion, debt included. The new mergers are part of an arms race in which the most prominent companies seek the scale necessary to lower production costs while having the flexibility to take shale oil production offline when demand wanes—or ramp it up dramatically when demand spikes.
Pioneer and ExxonMobil, for instance, intend to boost production by 700,000 barrels of oil and gas per day over the next four years. This surplus supply could help mitigate future price volatility associated with geopolitical turmoil.6
Final Thoughts
When war breaks out and horrific images dominate the news, human suffering touches us all. It’s a time to reconnect with our family, friends, and community and commit to making the world a more just and safe place. Our hearts go out to those touched by conflict.
We look forward to a day when the ups and downs of markets are driven by economics and not political instability.
1. Morningstar Direct as of October 31, 2023
2. Morningstar Direct as of October 31, 2023
3. Morningstar Direct as of October 31, 2023
4. Omeokwe, A. and Guilford, G., “U.S. Economy Grew a Strong 4.9%, Driven by Consumer Spree That May Not Last,” Wall Street Journal, October 26, 2023. https://www.wsj.com/economy/central-banking/us-gdp-economy-third-quarter-f247fa45
5. Daoud, Z., Altstein, G., and Sakthivel, B., “Israel-Hamas War Impact Could Tip Global Economy Into Recession,” Bloomberg.com, October 13, 2023. https://www.bloomberg.com/news/features/2023-10-12/israel-hamas-war-impact-could-tip-global-economy-into-recession
6. Smyth, J., McCormick, M., Sheppard, D., and Fontanella-Khan, J., “Dealmakers See Chevron-Hess Tie-Up as the Start of Oil ‘Arms Race,’ Financial Times, October 24, 2023. https://www.ft.com/content/42751474-ea28-4bc2-838b-50d564b93189
Symmetry Partners, LLC, is an investment advisory firm registered with the Securities and Exchange Commission (SEC).
The firm only transacts business in states where it is properly registered or excluded or exempt from registration requirements. Registration with the SEC or any state securities authority does not imply a certain level of skill or training. Different types of investments involve varying degrees of risk, and there can be no assurance that the future performance of any specific investment, investment strategy, product or any non-investment-related content made reference to directly or indirectly in this commentary will be profitable, equal any corresponding indicated historical performance level(s), be suitable for your portfolio or individual situation, or prove successful. Due to various factors, including changing market conditions and/or applicable laws, the content may not be reflective of current opinions or positions. Please note the material is provided for educational and background use only. Moreover, you should not assume that any discussion or information contained in this material serves as the receipt of, or as a substitute for, personalized investment advice. Diversification seeks to improve performance by spreading your investment dollars into various asset classes to add balance to your portfolio. Using this methodology, however, does not guarantee a profit or protection from loss in a declining market. Past performance does not guarantee future results.
Index Disclosure and Definitions All indexes have certain limitations. Investors cannot invest directly in an index. Indexes have no fees. Historical performance results for investment indexes generally do not reflect the deduction of transaction and/or custodial charges or the deduction of an investment management fee, the incurrence of which would have the effect of decreasing historical performance. Actual performance for client accounts may differ materially from the index portfolios.
S&P 500 Index represents the 500 leading U.S. companies, approximately 80% of the total U.S. market capitalization. Dow Jones Industrial Average (DJIA) Is a price-weighted average of 30 significant stocks traded on the New York Stock Exchange (NYSE) and the NASDAQ. The Nasdaq Composite Index (NASDAQ) measures all Nasdaq domestic and international based common-type stocks listed on The Nasdaq Stock Market and includes over 2,500 companies. MSCI World Ex USA GR USD Index captures large and mid-cap representation across 22 of 23 developed markets countries, excluding the U.S. The index covers approximately 85% of the free float-adjusted market capitalization in each country. MSCI Emerging Markets Index is a free float-adjusted market capitalization index that is designed to measure equity market performance in the global emerging markets (as defined by MSCI). The index consists of the 25 emerging market country indexes. Bloomberg U.S. Aggregate Bond Index measures the performance of the U.S. investment grade bond market. The index invests in a wide spectrum of public, investment-grade, taxable, fixed-income securities in the United States—including government, corporate, and international dollar-denominated bonds, as well as mortgage-backed and asset-backed securities, all with maturities of more than 1 year. Bloomberg Global Aggregate (USD Hedged) Index is a flagship measure of global investment grade debt from twenty-four local currency markets. This multi-currency benchmark includes treasury, government-related, corporate and securitized fixed-rate bonds from both developed and emerging market issuers. Index is USD hedged. Stock returns represented by Fama/French Total U.S. Market Research Index, provided by Ken French and available at http://mba.tuck.dartmouth.edu/pages/faculty/ken.french/data_library.html. This value-weighed U.S. market index is constructed every month, using all issues listed on the NYSE, AMEX, or Nasdaq with available outstanding shares and valid prices for that month and the month before. Exclusions: American depositary receipts. Sources: CRSP for value-weighted U.S. market return. Rebalancing: Monthly. Dividends: Reinvested in the paying company until the portfolio is rebalanced.
© Morningstar 2023. All rights reserved. The information contained herein: (1) is proprietary to Morningstar and/or its content providers; (2) may not be copied, adapted, or distributed; and (3) is not warranted to be accurate, complete, or timely. Neither Morningstar nor its content providers are responsible for any damages or losses arising from any use of this information, except where such damages or losses cannot be limited or excluded by law in your jurisdiction. Past financial performance is no guarantee of future results.