

Big Picture
The third quarter of 2022 has been an emotional ride for many investors. In July, despite heightened inflation readings, markets responded positively to strong corporate earnings, and the S&P 500 returned 9.22% for the month. Investors, hopeful the Fed could engineer a soft landing, kept markets aloft through the middle
of August. But by mid-month, data suggesting a global economic slowdown and hawkish comments by Federal Reserve Chair Jerome Powell at the central bank’s annual symposium in Jackson Hole, were
enough to end the summer rally. From mid-August through the end of September, the S&P 500, Dow Jones Industrial Average, and Nasdaq Composite tumbled back into bear market territory. They finished the quarter recording their worst first nine months of a calendar year since the tech bubble collapse in 2002.
Equities
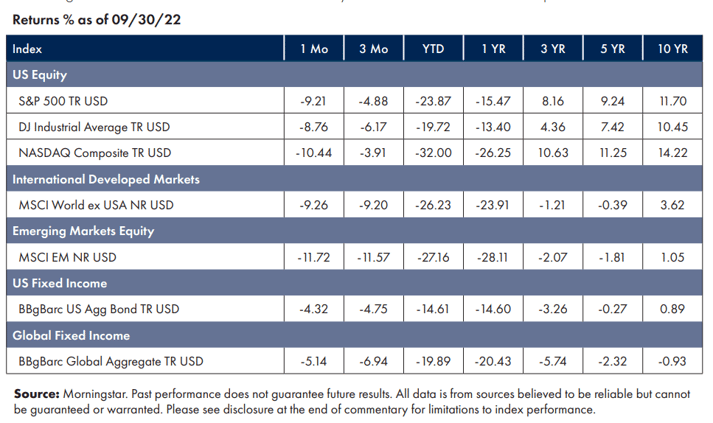
Equities posted a strong run through July and the first half of August but surrendered those gains in the second half of the quarter and ended down across the board.
All three major U.S. equity indexes have fallen into bear market territory, with the S&P 500 and NASDAQ on a three quarter losing streakCentral banks around the globe followed the Fed’s lead in raising rates, and international and emerging market equities suffered.1
Fixed income
Bond markets also continued to struggle and were firmly down for the quarter.
The Bloomberg S. Aggregate bond index—predominantly U.S. Treasury’s, highly rated corporate bonds, and mortgage- backed securities—continued to post negative performance.The Bloomberg Barclays Global Aggregate Index, representing bonds from both developed and emerging markets, ended down over 5% for the quarter.2
Factors
Exposure to investment risk factors was something of a mixed bag this quarter. While several factor exposures outperformed markets on a relative basis – Minimum Volatility, Value, and Momentum – all were negative for the quarter.3
NEWS Impacting Markets
Inflation
Data suggests the overall pace of inflation has cooled a bit, led by a significant decline in gasoline prices over the quarter. However, August’s Labor Department’s CPI report indicated that higher inflation levels have become more embedded across the overall economy, particularly in food and housing. Consumers have had some relief when filling up their gas tanks, though not when filling up their grocery baskets or paying rent, and as long as that persists, this issue will continue to dominate headlines.
The Fed
Combating Inflation has become the primary focus for the Fed. The Federal Open Market Committee (FOMC) — the panel of Fed officials responsible for monetary policy— hiked its baseline interest rate by 0.75 percentage points for an unprecedented third consecutive meeting in mid-September. Fed officials have pledged to keep ramping up rates to tame inflation before it spirals any further out of control. However, market participants are doubtful that the Fed can do so without derailing the steady economic growth and low unemployment of the post-pandemic period, and fears of recession loom.
The Strength of the US Dollar
Due to a combination of the Federal Reserve’s actions raising rates and a host of economic concerns across the globe, there has been a strengthening of the US dollar relative to other currencies, and the dollar has surged to historic highs against the British pound, the Japanese yen, and other currencies. As the dollar is the main currency used in trade (ex: commodities like food and oil are usually priced in dollars), this has had a global economic impact. One benefit to US consumers is that this makes imported goods cheaper; the flip side of that coin is that US exports become more expensive for international buyers, who tend to curtail their purchases as a result. This can wreak havoc with the profits of US companies that do a lot of business overseas (roughly 40% of the revenue for S&P 500 companies comes from outside of the US). The expected decline in earnings can put downward pressure on valuations – causing the price of stocks to fall.
Final Thoughts
This has been a rough year for both equities and fixed income. Through September 30th, a 60/40 balanced portfolio of stocks and bonds (using the S&P 500 and Barclays Aggregate Bond Index) is now down -20.2%.4 While it can seem an empty platitude to hear “stay the course,” that advice comes from observing the most favorable outcome over decades of various market environments. Some of the best days in the market are clustered among some of the worst days. Looking at market data going back to 1928, being out of the stock market for just the best 30 trading days would have resulted in half the return over that period.5 Time and again, we see that the optimal path is to stay fully invested and broadly diversified. Nobody promised patience would be easy…just that it would be rewarded in time.
We will continue to monitor markets and guide you through these turbulent waters until smoother sailing prevails.
1 Morningstar Direct, as of Oct 1, 2022
2 Morningstar Direct, as of Oct 1, 2022
3 Morningstar Direct, as of Oct 1, 2022
4 John Hancock, Market Intelligence, Sept 30, 2022
Symmetry Partners, LLC, is an investment advisory firm registered with the Securities and Exchange Commission (SEC).
The firm only transacts business in states where it is properly registered, or excluded or exempt from registration requirements. Registration with the SEC or any state securities authority does not imply a certain level of skill or training. Different types of investments involve varying degrees of risk, and there can be no assurance that the future performance of any specific investment, investment strategy, product or any non- investment related content made reference to directly or indirectly in this commentary will be profitable, equal any corresponding indicated historical performance level(s), be suitable for your portfolio or individual situation, or prove successful. Due to various factors, including changing market conditions and/or applicable laws, the content may not be reflective of current opinions or positions. Please note the material is provided for educational and background use only. Moreover, you should not assume that any discussion or information contained in this material serves as the receipt of, or as a substitute for, personalized investment advice. Diversification seeks to improve performance by spreading your investment dollars into various asset classes to add balance to your portfolio. Using this methodology, however, does not guarantee a profit or protection from loss in a declining market. Past performance does not guarantee future results.
Index Disclosure and Definitions All indexes have certain limitations. Investors cannot invest directly in an index. Indexes have no fees. Historical performance results for investment indexes generally do not reflect the deduction of transaction and/or custodial charges or the deduction of an investment management fee, the incurrence of which would have the effect of decreasing historical performance. Actual performance for client accounts may differ materially from the index portfolios.
S&P 500 Index represents the 500 leading U.S. companies, approximately 80% of the total U.S. market capitalization. Dow Jones Industrial Average (DJIA) Is a price-weighted average of 30 significant stocks traded on the New York Stock Exchange (NYSE) and the NASDAQ. The Nasdaq Composite Index (NASDAQ) measures all Nasdaq domestic and international based common type stocks listed on The Nasdaq Stock Market, and includes over 2,500 companies. MSCI World Ex USA GR USD Index captures large and mid cap representation across 22 of 23 developed markets countries, excluding the US. The index covers approximately 85% of the free float-adjusted market capitalization in each country. MSCI Emerging Markets Index is a free float-adjusted market capitalization index that is designed to measure equity market performance in the global emerging markets (as defined by MSCI). The index consists of the 25 emerging market country indexes. Bloomberg Barclays US Aggregate Bond Index measures the performance of the U.S. investment grade bond market. The index invests in a wide spectrum of public, investment-grade, taxable, fixed income securities in the United States – including government, corporate, and international dollar-denominated bonds, as well as mortgage-backed and asset-backed securities, all with maturities of more than 1 year. Bloomberg Barclays Global Aggregate (USD Hedged) Index is a flagship measure of global investment grade debt from twenty-four local currency markets. This multi-currency benchmark includes treasury, government-related, corporate and securitized fixed-rate bonds from both developed and emerging market issuers. Index is USD hedged.
© Morningstar 2022. All rights reserved. The information contained herein: (1) is proprietary to Morningstar and/or its content providers; (2) may not be copied, adapted or distributed; and (3) is not warranted to be accurate, complete or timely. Neither Morningstar nor its content providers are responsible for any damages or losses arising from any use of this information, except where such damages or losses cannot be limited or excluded by law in your jurisdiction. Past financial performance is no guarantee of future results.