Midterms & Markets – What You Should Know
Midterm elections are just around the corner, and many investors have expressed concerns that the outcome will dramatically impact the economy and financial markets.
While historical precedent is never a guarantee for how future events might unfold, it can be a helpful guide to steer expectations. So, what does the historical record indicate about midterms?
U.S. Midterm Elections in Perspective
Held at the mid-point of a presidency every four years, midterm elections can shift control of Congress, as all 435 members of the House of Representatives are up for election, and 35 of 100 seats of the Senate are up for election. Currently, the Democrats hold the presidency, a five-seat majority in the House of Representatives, and the Senate is split 50/50 (with the Vice President serving as a tie-breaking vote).
However, history has not been kind to the political party in power. Since World War II, the president’s party has lost House seats in 17 of 19 midterm elections, averaging a loss of 30 seats, as well as losing seats in the Senate in 13 of 19 midterms, averaging a loss of 3-4 seats.[1]
Market Performance Around Midterms
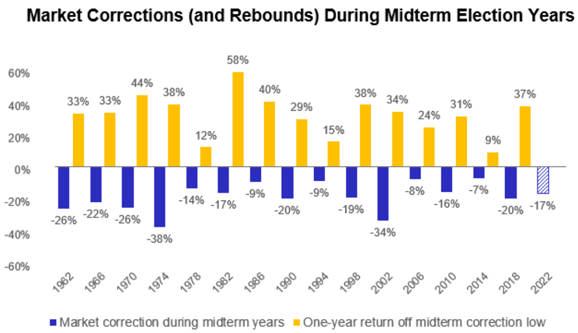
As the chart below shows, during midterm election years, markets have typically seen heightened volatility, and performance has routinely been lackluster for the year leading up to the election. Post-election, however, markets have tended to perform better than average.

Source: Robert W Baird & Co. (May 13, 2022). Washington Policy Research
Since 1961, the average annual return of the S&P 500 has been 8.1%.[2] During that same period, however, average performance around midterm elations has been dramatically different:
- 0.3% for the 12 months leading up to a midterm election (Nov. 1-Oct. 31)
- 16.3% for the 12 months after the mid-terms (Nov. 1-Oct. 31)
Markets hate uncertainty, and election years provide a higher dose of policy uncertainty before the election, which resolves into a more reliable picture of potential policy post-election.
Thus far this year, equity and fixed income markets have struggled to overcome challenges associated with slowing global growth, rising interest rates, heightened inflation, and geopolitical tensions. Midterm election results are unlikely to resolve those issues anytime soon, and markets will likely continue to be sensitive to headline news regarding those topics.
Big Picture
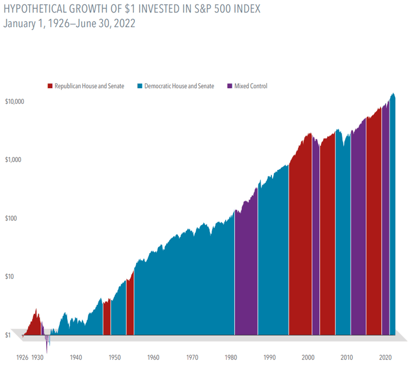
Midterm elections generate a lot of uncertainty over the short term. It may be tempting for investors to try to anticipate how elections might resolve and guess how those results might impact markets. This tends to be an incredibly challenging feat, mainly because there is no consistent relationship between which party is in charge and long-term investment results (see chart below).

Source: Growth of wealth shows the growth of a hypothetical investment of $1 in the securities in the S&P 500 Index. S&P data © 2022 S&P Dow Jones Indices LLC, a division of S&P Global
We would caution against making any changes to an established investment plan to try and profit (or avoid loss) from changes in the political landscape.
For investors focused on the long run, the best way to handle any election is to maintain a broadly diversified, factor-based portfolio, which can significantly hedge the risk associated with U.S. elections by being exposed to a variety of other nations, markets, and investments that might not be nearly as volatile during our election season.
[1] “Seats in Congress gained/lost by the president’s party in midterm elections,” The American Presidency Project.
[2] Bloomberg, October 31, 1961-December 31, 2021.
Symmetry Partners, LLC, provides this communication on this site as a matter of general information. Information contained herein, including data or statistics quoted, are from sources believed to be reliable but cannot be guaranteed or warranted. Due to various factors, including changing market conditions and/or applicable laws, the content may not be reflective of current opinions or positions. All content on this site is for educational purposes and should not be considered investment advice, recommendation or offer of any security for sale. Symmetry Partners does not approve or endorse any third party communications on this site and will not be liable for any such posts.
Symmetry Partners, LLC is an investment advisory firm registered with the Securities and Exchange Commission (SEC). The firm only transacts business in states where it is properly registered or excluded or exempt from registration requirements. Registration of an investment adviser does not imply any specific level of skill or training and does not constitute an endorsement of the firm by the Commission.
S&P 500 Index represents the 500 leading U.S. companies, approximately 80% of the total U.S. market capitalization.
All indexes have certain limitations. Investors cannot invest directly in an index. Indexes have no fees. Historical performance results for investment indexes generally do not reflect the deduction of transaction and/or custodial charges or the deduction of an investment management fee, the incurrence of which would have the effect of decreasing historical performance. Actual performance for client accounts may differ materially from the index portfolios.
Investing involves risk, including the loss of some or all of your principal. Diversification seeks to reduce volatility by spreading your investment dollars into various asset classes to add balance to your portfolio. Using this methodology, however, does not guarantee a profit or protection from loss in a declining market