

For many investors, the S&P 500 is the U.S. stock market. Comprised of the nation’s 500 largest companies with 80% of the U.S. market cap, it is a core holding in many portfolios via numerous index funds and ETFs, representing trillions of dollars.
It also is becoming increasingly risky. Just six stocks— Facebook, Amazon, Apple, Netflix, Google (Alphabet), and Microsoft—now represent almost 25% of the S&P’s market capitalization. This historic level of concentration in a handful of names—all in technology—has been increasingly rapidly, jumping 68% in little more than 18 months.[1]
Like the boy who cried wolf, some stock market analysts and commentators have been sounding the alarm about the risks represented by these six stocks—which are collectively and somewhat awkwardly referred to as FAANGM. But no crash has occurred, and many investors have tuned out the warnings and continued to pour money in.
Of course, what really excites investors—and makes them ignore the increasing dangers—is performance. Since the end of 2012, these six stock have returned an astonishing 714%. Over this same period, the S&P 500 returned just 197%. Take out the FAANGM stocks, and its return dropped to 145%.[2]
The size of these six companies is truly staggering Their combined market capitalization exceeds $9.3 trillion (which has more than doubled from $4 trillion since the end of 2019).[3] They are now bigger than all but two world markets: the United States (excluding these six companies) and China. Apple, the largest company of the six, and the biggest company in the world, has a market cap of more than $2.4 tillion, which exceeds the market cap of great industrial powers such as Germany and South Korea.[4]
Netflix is actually only the 31st largest company in the U.S., but is included in the fearsome FAANGM because of its strong performance in the last few years. Meanwhile less hyped and “cutting edge” tech firms such as Cisco and Intel are ignored and left out of the tech alphabet soup.
Since the stock market is forward-looking, it tends to focus on what is expected to happen in the future, rather than what occurred in the past. Forward P/E ratio is one of the tools analysts use--comparing current earnings to expected future earnings. The forward P/E ratio of the FAANGMs is 36.1, down somewhat from the beginning of the year, but still significantly higher than the S&P’s current forward P/E ratio of 21.4. Which drops to 18.5, and closer to the long/term PE average of 15, if the FAANGM stocks are removed.
The high forward P/E ratio of the FAANGs assume exceptional future growth, with no slowdowns or hiccups. These companies are priced to perfection, with little room for error or the unexpected.
The last time we saw similar high concentration in a handful of names was in 2000 when the Dot Com bubble burst. At that time, the top five S&P 500 companies by market cap were Microsoft, General Electric, Cisco, Intel, and Wal Mart. They made up about 18% of the S&P’s market cap.[5]
If we’ve learned anything from the history of markets, it is that today’s leading companies are rarely tomorrow’s. According to a 2016 report by Innosight (“Corporate Longevity: Turbulence Ahead for Large Organizations“) corporations in the S&P 500 Index in 1965 stayed in the index for an average of 33 years. By 1990, average tenure in the S&P 500 had narrowed to 20 years and is now forecast to shrink to 14 years by 2026. At the current churn rate, about half of today’s S&P 500 firms will be replaced over the next 10 years. Only 52 companies have managed to remain in the Fortune 500 since 1955. It is more than likely than today’s tech leaders will be replaced by firms that will be more innovative and nimble and successful.
And they may not even be tech firms.
A little more than six years, Etsy, an online purveyor of handicrafts and garage sale and thrift shop finds, went public. While it is ostensibly a tech firm—it is a website after all—it is usually classified under business services. It certainly is no one’s idea of a tech titan. Yet as the chart below shows, since its IPO in the middle of April 2015, it handily defeated all of FAANGM stocks, returning almost 795% (through 7/30/21). Its closest competitor was Amazon at a little more than 753%. Decidedly low tech, Domino’s Pizza, at 288% was in a virtual dead heat with Google—at 392%--and trounced Facebook, which returned a little more than 352% and Apple at 365%.
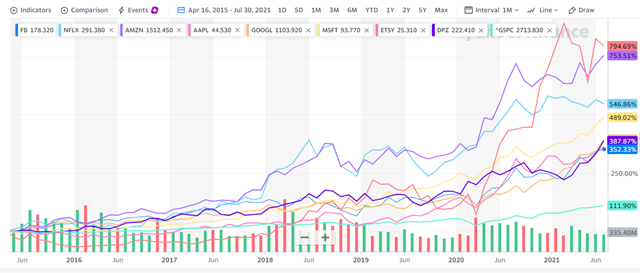
Source: Yahoo Finance
But no one is talking about FAANGME. It is easy for investors to get caught up in tech fever and obsess about companies that are “changing the world,” while forgetting that uninspiring pizza and handicrafts can also turn in stellar performances. That is why we believe in owning the market broadly, and not trying to pick and choose tomorrow’s winners. The risk of our current situation is not just to those invested heavily in the FAANGMs--if anything happens to make the future outlook for this handful of tech names seem less than perfect, the damage to the larger S&P 500 could be substantial (although Small and Value stocks may offer safer havens).
While many investors will probably continue to ignore the warnings about FAANGM, it is instructive to remember how the story of the boy who cried wolf ends. Eventually, a real wolf shows up. The villagers ignore the boy’s cries for help, and he is eaten, along with all the sheep.
[1] www.yardeni.com/pub/faangms.pdf
[2] www.yardeni.com/pub/faangms.pdf
[3] Ibid.
[4] https://data.worldbank.org/indicator/CM.MKT.LCAP.CD
[5] www.ccn.com/stock-market-warning-6-mega-stocks-dominate-sp-500s-21-4-trillion-cap/
Symmetry Partners, LLC, provides this communication on this site as a matter of general information. Information contained herein, including data or statistics quoted, are from sources believed to be reliable but cannot be guaranteed or warranted. Nothing on this site represents a recommendation of any particular security, strategy, or investment product. The opinions of the author are subject to change without notice. Due to various factors, including changing market conditions and/or applicable laws, the content may not be reflective of current opinions or positions. All content on this site is for educational purposes and should not be considered investment advice or an offer of any security for sale. Please be advised that Symmetry Partners does not provide tax or legal advice and nothing either stated or implied here on this site should be inferred as providing such advice. Symmetry Partners does not approve or endorse any third party communications on this site and will not be liable for any such posts.
Diversification seeks to reduce volatility by spreading your investment dollars into various asset classes to add balance to your portfolio. Using this methodology, however, does not guarantee a profit or protection from loss in a declining market. Past performance doesn’t guarantee future results. It is not possible to invest directly in an index.