Sometimes You Get The Bear…Sometimes The Bear Gets You
In markets, the terms “bull” and “bear” refer to optimists and pessimists. While the terms come to us from early 18th century Britain, their use to describe more sustained upward/downward movements as bull and bear markets didn’t really become common until the late 1950’s. Stocks are considered to have entered a “bear market” when widely followed indexes such as the S&P 500 or the NASDAQ sink 20% from their most recent high points. It is not an official designation, rather it’s a way for market participants to mark when markets have taken a tumble…and tumble they have.

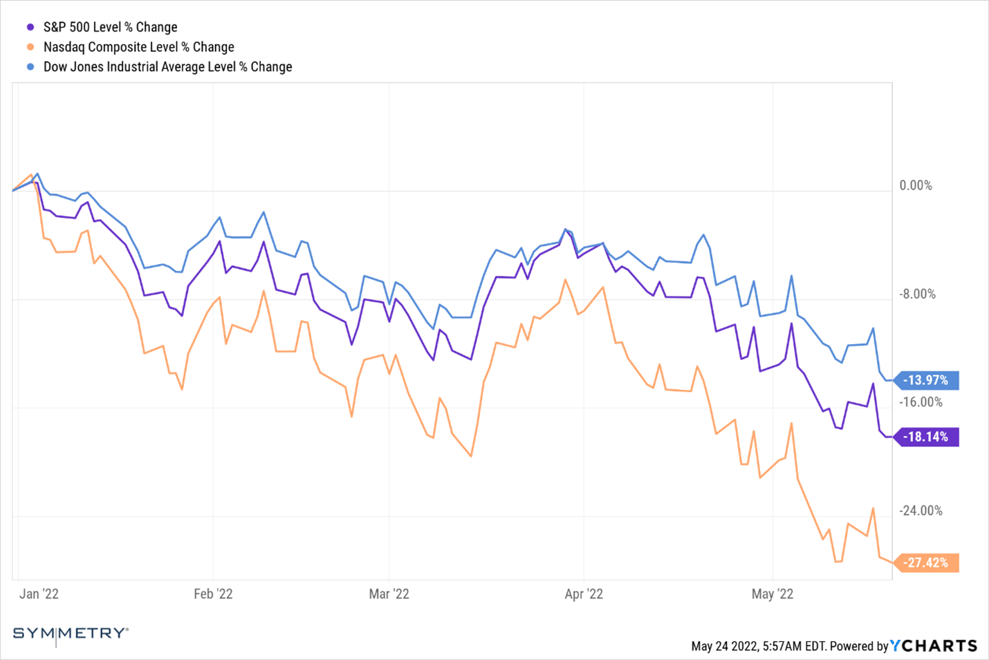
As of the end of last Friday (5/20) the Dow industrials posted their eighth straight weekly loss, the longest streak since the Great Depression (1932). The S&P 500 and Nasdaq had their seventh straight weekly loss, their longest such streak since the bursting of the dot-com bubble (2001). The sell-off has been broad and deep as investors grapple with a confluence of issues - a shift in interest rates, supply chain snarls, inflationary pressures, and geo-political challenges.
However, investors would do well to keep some perspective about how markets behave, particularly when it comes to bear markets.
Characteristics of bear markets:
- They are an inescapable feature of investing. In fact, without them, there would be no bull markets.
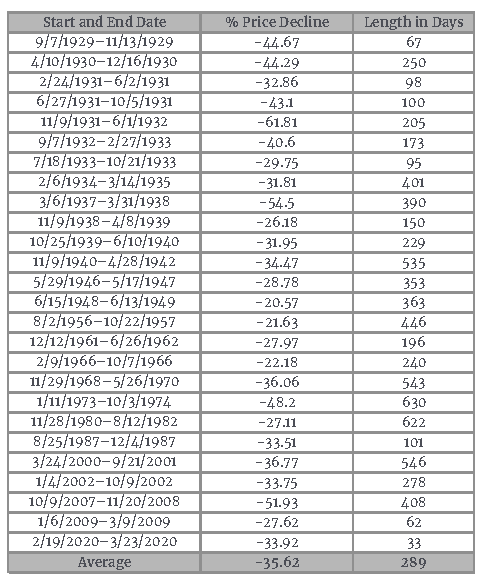
- They are normal – there have been 26 of them since 1928 (roughly one every 3.6 years). There have been 27 bull markets across that same time span.
- They tend to be short in duration – the average length is 298 days. Meanwhile, bull markets average length is 991 days. In other words, over the last 92 years investors experienced bear markets roughly 20% of the time, while enjoying bull markets roughly 78% of the time.
- Some of the best days in the market occur during a bear market (miss just a few of those and the negative impact to long term returns can be significant).
S&P 500 Index declines of 20% or more, 1929–2021

Source: Ned Davis Research, 12/21.
Bear markets are inevitable, and predictable in how investors react to them. They tend to feel terrible and eventually many investors give up and sell. When things look the worst, and most investors finally “capitulate” it often marks a turning point, and the green shoots of the next bull market are born.
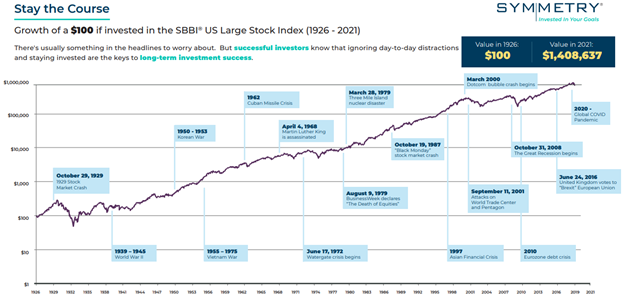
It can be difficult to weather the storm, and ride it out, but long-term benefits await the disciplined investor who can do so.

Source: Morningstar
Hypothetical Illustration. Past performance does not guarantee future results. All data is from sources believed to be reliable but cannot be guaranteed or warranted. See disclosure below for limitations to performance information.
Symmetry Partners, LLC, provides this communication on this site as a matter of general information. Information contained herein, including data or statistics quoted, are from sources believed to be reliable but cannot be guaranteed or warranted. Due to various factors, including changing market conditions and/or applicable laws, the content may not be reflective of current opinions or positions. All content on this site is for educational purposes and should not be considered investment advice, recommendation or offer of any security for sale.. Symmetry Partners does not approve or endorse any third party communications on this site and will not be liable for any such posts.
Symmetry Partners, LLC is an investment advisory firm registered with the Securities and Exchange Commission (SEC). The firm only transacts business in states where it is properly registered or excluded or exempt from registration requirements. Registration of an investment adviser does not imply any specific level of skill or training and does not constitute an endorsement of the firm by the Commission.
Investing involves risk, including the loss of some or all of your principal. Diversification seeks to reduce volatility by spreading your investment dollars into various asset classes to add balance to your portfolio. Using this methodology, however, does not guarantee a profit or protection from loss in a declining market.
Index Disclosure and Definitions All indexes have certain limitations. Investors cannot invest directly in an index. Indexes have no fees. Historical performance results for investment indexes generally do not reflect the deduction of transaction and/or custodial charges or the deduction of an investment management fee, the incurrence of which would have the effect of decreasing historical performance. Actual performance for client accounts may differ materially from the index portfolios.
S&P 500 Index represents the 500 leading U.S. companies, approximately 80% of the total U.S. market capitalization. Dow Jones Industrial Average (DJIA) Is a price-weighted average of 30 significant stocks traded on the New York Stock Exchange (NYSE) and the NASDAQ. The Nasdaq Composite Index (NASDAQ) measures all Nasdaq domestic and international based common type stocks listed on The Nasdaq Stock Market, and includes over 2,500 companies.
Morningstar 2022. All rights reserved. The information contained herein: (1) is proprietary to Morningstar and/or its content providers; (2) may not be copied, adapted or distributed; and (3) is not warranted to be accurate, complete or timely. Neither Morningstar nor its content providers are responsible for any damages or losses arising from any use of this information, except where such damages or losses cannot be limited or excluded by law in your jurisdiction.
