
-5.png)
Big Picture
Markets took investors for a roller coaster ride in March. All eyes were on Fed Chair Jerome Powell’s Senate Banking Committee remarks at the beginning of the month. His comments caused futures to jump in the days that followed to a 70% likelihood that the Fed would increase rates by an additional 50 basis points at the FOMC meeting (March 21-23). Then, banks began to collapse. Silvergate Bank’s demise was swiftly followed by a “run” on Silicon Valley Bank, followed by the closing of Signature Bank by New York State regulators, punctuated by Credit Suisse’s failure in Europe. Markets took notice…the number of stocks, ETFs, and other instruments trading on the New York Stock Exchange and Nasdaq that hit a new 52-week low was at the highest since last fall. Finally, governments stepped in and backstopped depositors. The run on banks was halted (for now). The Fed did raise rates, but only 25 bps and markets responded positively, rebounding at the end of the month.
Equities
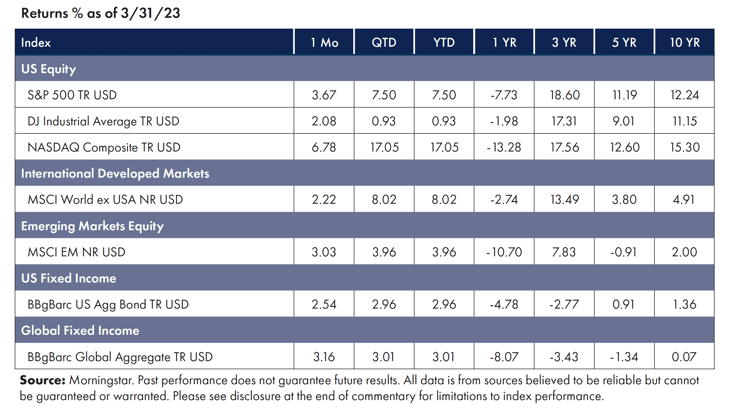
Despite significant volatility, stocks managed to post positive performance.
- Across markets, large technology stocks outperformed, while financials and small caps were pummeled.
- Energy-related commodities experienced losses, while Precious Metals were a bright spot (particularly gold).[1]
Fixed Income
Bank failures fueled recession fears and a massive investor flight to safety across the yield curve.
- After hitting 4% in early March, 10-year treasuries ended the quarter under 3.5%, only slightly above the YTD low.
- The 10/2yr US yield curve remained deeply inverted.[2]
Factors
Risk factors have been a mixed bag for the month as a flight to quality impacted risk assets. In the U.S. and International Developed markets, Quality was a significant outperformer. Value and Minimum Volatility led in Emerging Markets, though slightly trailed market beta.[3]
NEWS Impacting Markets
The Fed
The Fed Chair's testimony before the Senate Banking Committee signaled a growing chance the central bank could lift rates by another half-percentage point later in the month. Markets braced for another round of tightening, with futures markets pricing in a 50bps rate hike and the spread between the two-year and 10-year Treasury yields closing below minus 100 basis points, or one percentage point, for the first time since September 1981. While the Federal Reserve continued its most aggressive tightening cycle in decades, it only raised rates 25 bps, bringing the fed funds rate to the highest target range since before the Global Financial Crisis.[4]
Banks
Bank failures roiled markets in March, and hammered niche segments of the economy. Silvergate Bank underpinned almost every American crypto company. Silicon Valley Bank was home to cash belonging to half of all venture-backed startups in the US. Signature Bank was a more minor but still crucial crypto-friendly bank. The rapid-fire collapse of these banks led had the potential to destabilize the financial system, until Federal regulators — the Fed, Treasury Department, and other agencies —announced that all customers would have access to their money by enacting a "systemic risk exception," allowing FDIC to use the Deposit Insurance Fund to ensure those with more than $250,000 not lose any of their deposits. While there continue to be reverberations across the banking sector, these steps have calmed markets.[5]
The Conundrum of Value (Revisited)
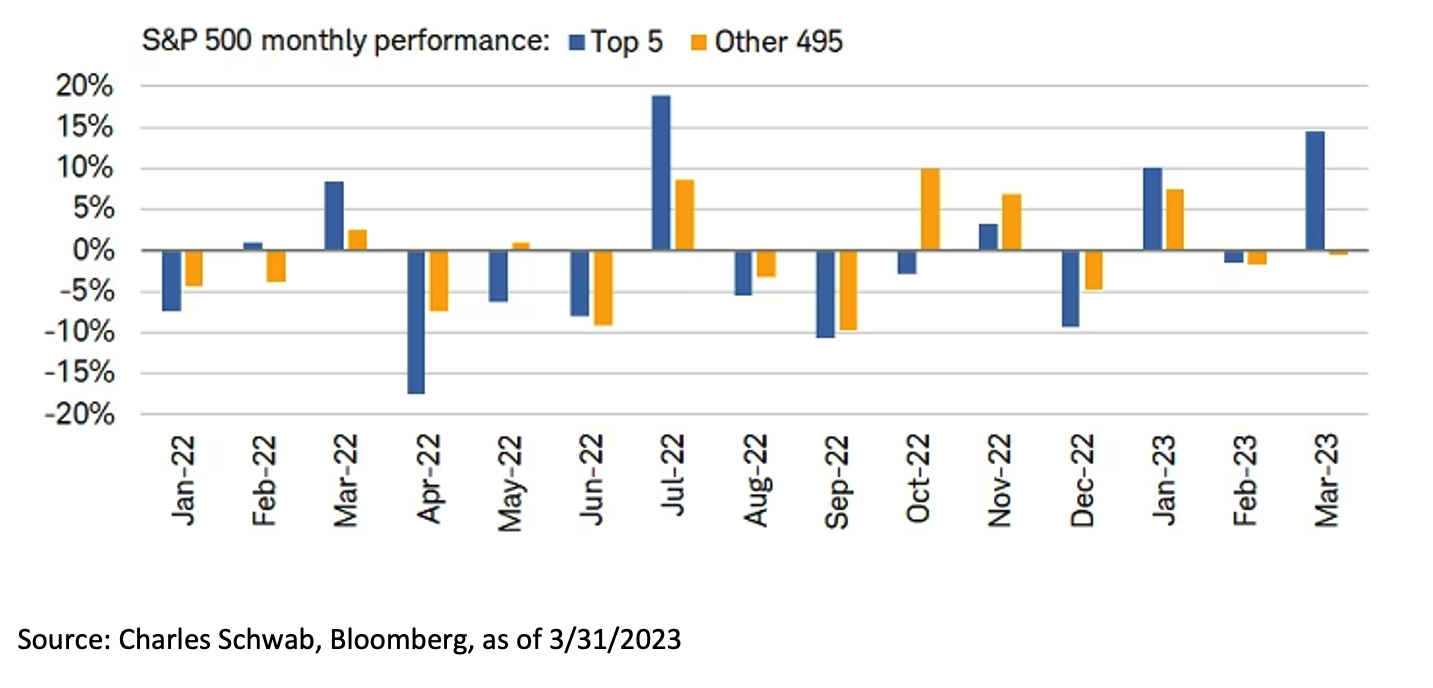
Markets seemed to have shrugged off the banking crisis and stubborn inflation to end the first quarter up. However, upon closer inspection, the lion’s share of market return has been driven by a handful of names (akin to what we observed in 2021). For instance, the ten largest stocks in the S&P 500 have been responsible for 90% of return through the end of the first quarter. These large-cap tech-centric names are led by Apple, Microsoft, and Nvidia (who contributed more than 50%) and rounded out by Tesla, Meta, Alphabet, Amazon, Salesforce, AMD, and Broadcom. Such concentration in a small number of names lends itself to potential drawdowns and bouts of volatility (akin to what we observed in 2022).[6]
Final Thoughts
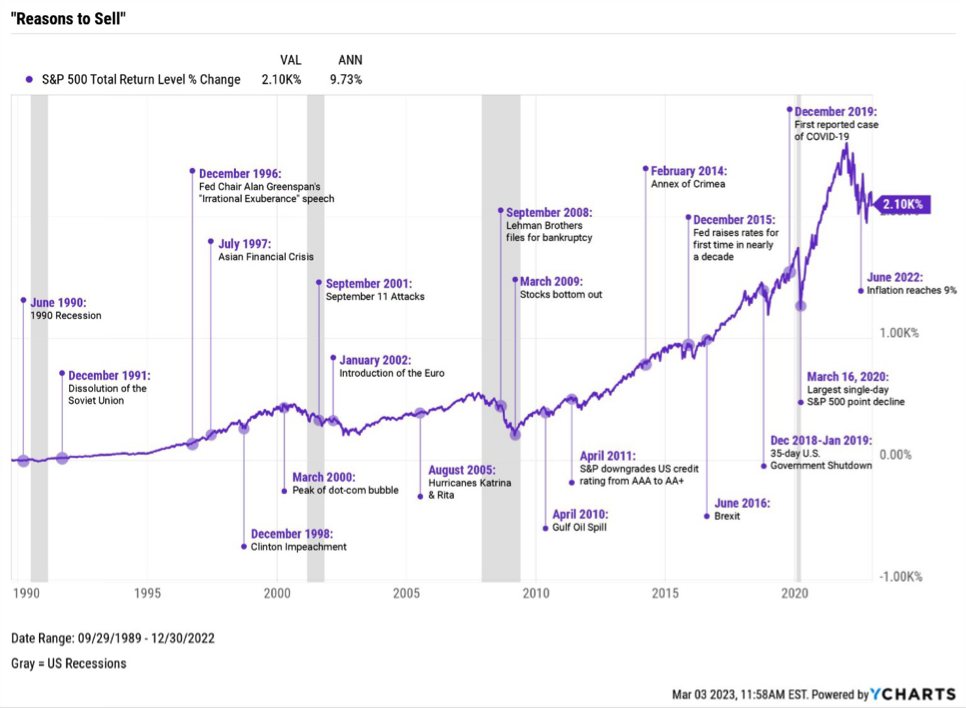
The world is complex and often chaotic, and market volatility can be unnerving, especially when exacerbated by headlines about persistent inflation, bank runs, and layoffs. However, markets are quick to adjust to the news, and reflect the risky nature of uncertain outcomes by rewarding investors with returns over time (as evidenced by the chart below). Investors are encouraged to stay patient and reap those potential long-term rewards.
[1] Morningstar Direct, as of Mar 31, 2023
[2] Morningstar Direct, as of Mar 31, 2023
[3] Morningstar Direct, as of Feb 28, 2023
[4] Timiraos, N. (2023, March 22). Fed Raises Rates but Nods to Greater Uncertainty After Banking Stress. WSJ. https://www.wsj.com/articles/fed-raises-rates-but-nods-to-greater-uncertainty-after-banking-stress-6ae9316f?mod=economy_more_pos20
[5] Choi, C. (2023, March 27). The Banking Crisis: A Timeline of Silicon Valley Bank’s Collapse and Other Key Events. WSJ. https://www.wsj.com/articles/bank-collapse-crisis-timeline-724f6458?mod=Searchresults_pos9&page=1
[6] Source: Charles Schwab, Bloomberg, as of 3/31/2023
Symmetry Partners, LLC, is an investment advisory firm registered with the Securities and Exchange Commission (SEC).
The firm only transacts business in states where it is properly registered, or excluded or exempt from registration requirements. Registration with the SEC or any state securities authority does not imply a certain level of skill or training. Different types of investments involve varying degrees of risk, and there can be no assurance that the future performance of any specific investment, investment strategy, product or any non- investment related content made reference to directly or indirectly in this commentary will be profitable, equal any corresponding indicated historical performance level(s), be suitable for your portfolio or individual situation, or prove successful. Due to various factors, including changing market conditions and/or applicable laws, the content may not be reflective of current opinions or positions. Please note the material is provided for educational and background use only. Moreover, you should not assume that any discussion or information contained in this material serves as the receipt of, or as a substitute for, personalized investment advice. Diversification seeks to improve performance by spreading your investment dollars into various asset classes to add balance to your portfolio. Using this methodology, however, does not guarantee a profit or protection from loss in a declining market. Past performance does not guarantee future results.
Index Disclosure and Definitions All indexes have certain limitations. Investors cannot invest directly in an index. Indexes have no fees. Historical performance results for investment indexes generally do not reflect the deduction of transaction and/or custodial charges or the deduction of an investment management fee, the incurrence of which would have the effect of decreasing historical performance. Actual performance for client accounts may differ materially from the index portfolios.
S&P 500 Index represents the 500 leading U.S. companies, approximately 80% of the total U.S. market capitalization. Dow Jones Industrial Average (DJIA) Is a price-weighted average of 30 significant stocks traded on the New York Stock Exchange (NYSE) and the NASDAQ. The Nasdaq Composite Index (NASDAQ) measures all Nasdaq domestic and international based common type stocks listed on The Nasdaq Stock Market, and includes over 2,500 companies. MSCI World Ex USA GR USD Index captures large and mid cap representation across 22 of 23 developed markets countries, excluding the US. The index covers approximately 85% of the free float-adjusted market capitalization in each country. MSCI Emerging Markets Index is a free float-adjusted market capitalization index that is designed to measure equity market performance in the global emerging markets (as defined by MSCI). The index consists of the 25 emerging market country indexes. Bloomberg US Aggregate Bond Index measures the performance of the U.S. investment grade bond market. The index invests in a wide spectrum of public, investment-grade, taxable, fixed income securities in the United States – including government, corporate, and international dollar-denominated bonds, as well as mortgage-backed and asset-backed securities, all with maturities of more than 1 year. Bloomberg Global Aggregate (USD Hedged) Index is a flagship measure of global investment grade debt from twenty-four local currency markets. This multi-currency benchmark includes treasury, government-related, corporate and securitized fixed-rate bonds from both developed and emerging market issuers. Index is USD hedged.
© Morningstar 2023. All rights reserved. The information contained herein: (1) is proprietary to Morningstar and/or its content providers; (2) may not be copied, adapted or distributed; and (3) is not warranted to be accurate, complete or timely. Neither Morningstar nor its content providers are responsible for any damages or losses arising from any use of this information, except where such damages or losses cannot be limited or excluded by law in your jurisdiction. Past financial performance is no guarantee of future results.