

By Casey Dylan, CIMA
Markets have been on a remarkable run of late, sending many indices to historic highs. However, in the words of Pat Sweeny, Principal and Co-Founder of Symmetry Partners, “NOW is the best time to prepare for the next downturn. We don’t know when it’s coming…just that it is.”
After a period of strong positive performance, it’s a perfect time for investors to make sure they are still positioned in a portfolio that gives them the greatest probability of achieving their long-term objectives.
We believe this means a portfolio that is broadly and globally diversified and tilted towards characteristics of risk that academic research has shown offer the long-term potential for outperformance (Value, Size, Momentum, Quality, Minimum Volatility, etc.). The ride can be bumpy at times, but being in the right portfolio and having the discipline to stay the course are key for achieving successful outcomes.
We do not claim to have any predictive power when it comes to markets or market participant behavior. However, several recent data points have raised some red flags that could indicate a potential pullback from the rich market valuations we have seen for some time.
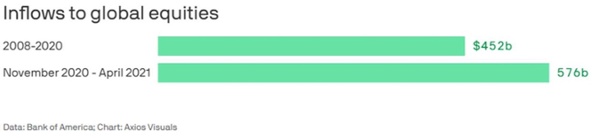
1. Money flowing to stocks globally in just the past five months ($576 billion) has exceeded the inflow seen over the prior 12 years by well over $100 billion, according to data from Bank of America Global Research. Historically these type of flows from retail investors have been associated with market tops, and in the past have been used as indicators to initiate selling by institutional investors.
2. The ratio of insiders’ stock sales to buys recently rose to 143-to-1, according to data from Sentiment Trader, the highest since 2006 and nearly double the previous high. When insiders, who have an intimate knowledge of a company’s near-term prospects collectively decide it’s time to take money off the table, that can be an indicator of a market top as well.
3. The signal from Citigroup’s gauge of investor sentiment — the Panic/Euphoria Model – is currently at a level would indicate a 100 per cent probability of lower share prices over the next 12 months. The last time it was this high and did not coincide with an immediate equity market correction was in 1999 when the dotcom bubble was in full bloom (which came along within 18 months).
There are lots of reasons being offered as to why “this time is different,” but it’s likely those are already built into current (lofty) prices, and downturns are a natural process across market cycles. Since 1932, bear markets (a decline of 20% or more) have occurred, on average, every 56 months (about four years and eight months), according to S&P Dow Jones Indices.
The evidence shows that the best way to prepare for a market downturn is the same way to prepare for a bull market: identify the level of risk that is appropriate for your unique situation and that will allow you to sleep at night, diversify across geographies, asset classes and risk factors, accept the up-and-down nature of markets, and stay the course for the long haul.
Symmetry Partners, LLC, provides this communication on this site as a matter of general information. Information contained herein, including data or statistics quoted, are from sources believed to be reliable but cannot be guaranteed or warranted. Nothing on this site represents a recommendation of any particular security, strategy, or investment product. The opinions of the author are subject to change without notice. Due to various factors, including changing market conditions and/or applicable laws, the content may not be reflective of current opinions or positions. All content on this site is for educational purposes and should not be considered investment advice or an offer of any security for sale. Please be advised that Symmetry Partners does not provide tax or legal advice and nothing either stated or implied here on this site should be inferred as providing such advice. Symmetry Partners does not approve or endorse any third party communications on this site and will not be liable for any such posts.
[1] “Do Downturns Lead to Down Years?” Dimensional Fund Advisors, 2021